How to use Microsoft Clarity to analyze user behavior on your website
There are only two Microsoft products that I respect and use regularly: Xbox and Clarity. Clarity is a free online service for analyzing user behavior on websites. It allows you to view anonymous session records, track scrolling and clicks, and view heat maps of your pages.
Why use Microsoft Clarity
Understanding user behavior helps you optimize your Web site. For example, you can find and fix broken JavaScript; identify buttons that are confusing users and replace them with clearer ones; find and fix areas on your site that cause high churn rate.
Who can benefit
Web designers and developers, online store owners, bloggers and professionals with personal websites, landing page creators, news outlet editors. In fact, anyone who needs insight into how users interact with their content — and where they fall off.
Creating an account and connecting your site
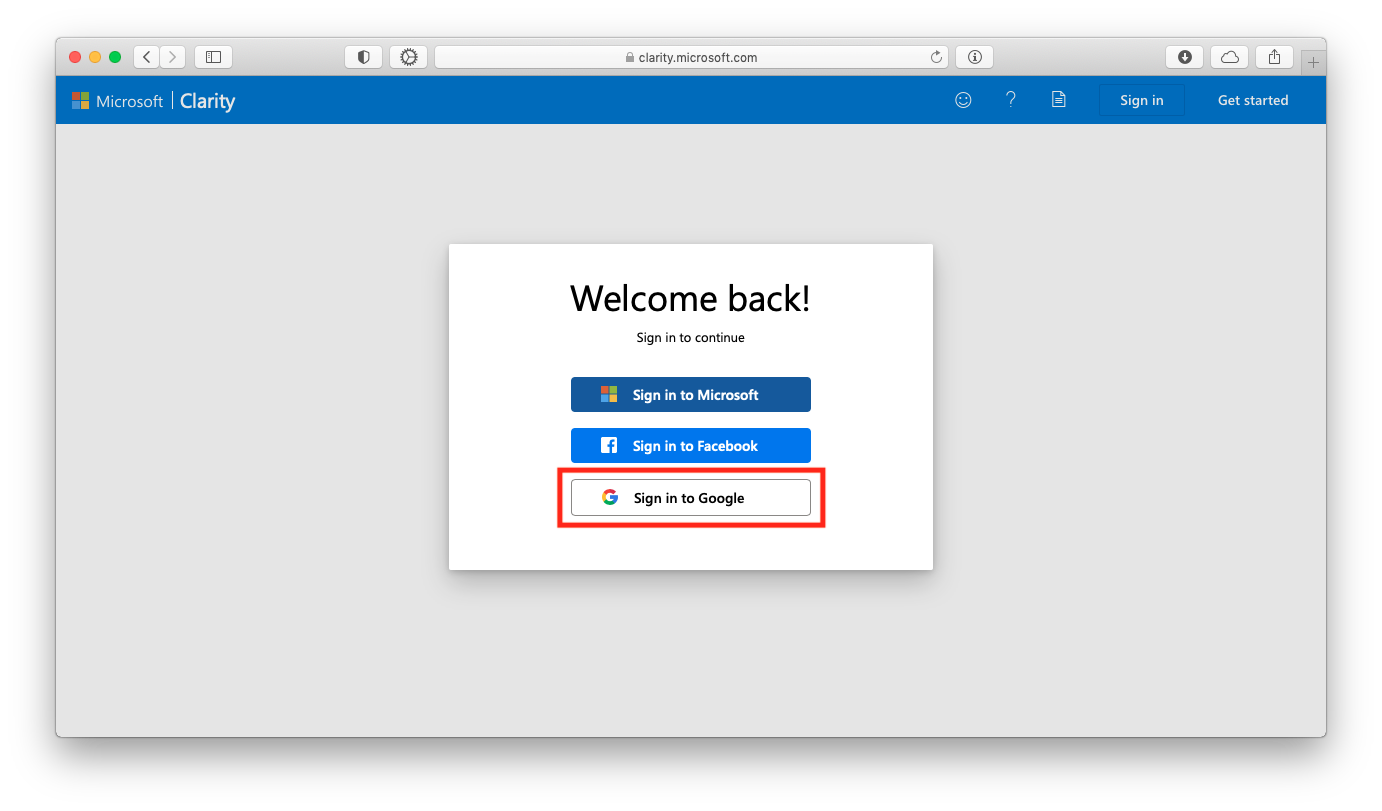
Visit the Clarity homepage and sign up. I recommend using your Google account associated with your site's Google Analytics, as this allows for seamless integration.
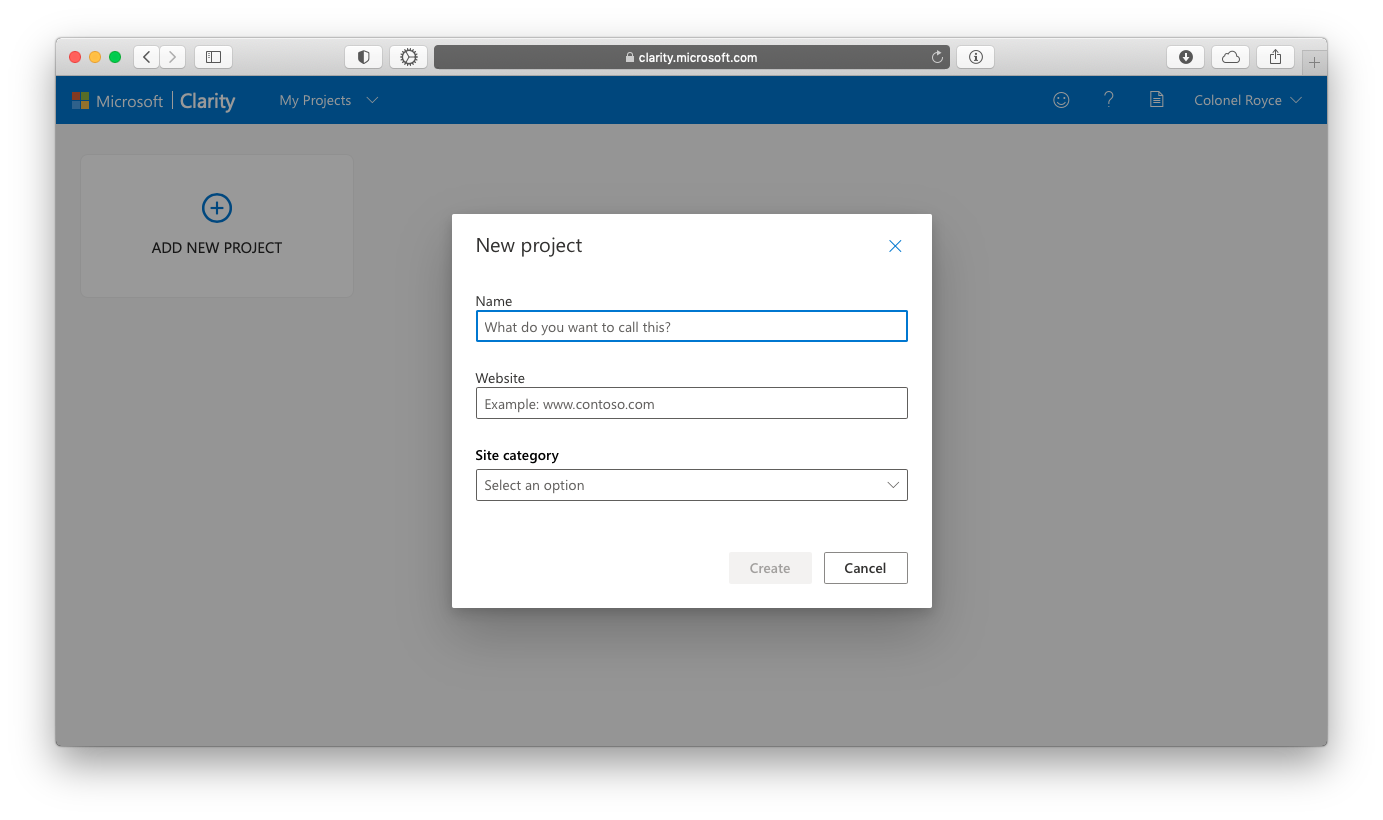
The system will ask you to create a project. This step is straightforward: name your project (this is for internal use only; users won't see it), enter your site address, and select a category. All three fields are required.
After this, you'll find yourself on the Settings page. From there you can connect your website and trigger Google Analytics integration.
Install the tracking pixel code
Copy the Clarity pixel-code (1). This code allows the system to collect data about sessions, users and their behavior on the site. Place the code between <head> and </head> tags on all pages of your site. This setup is similar to other tracking systems such as Facebook or Google Analytics.
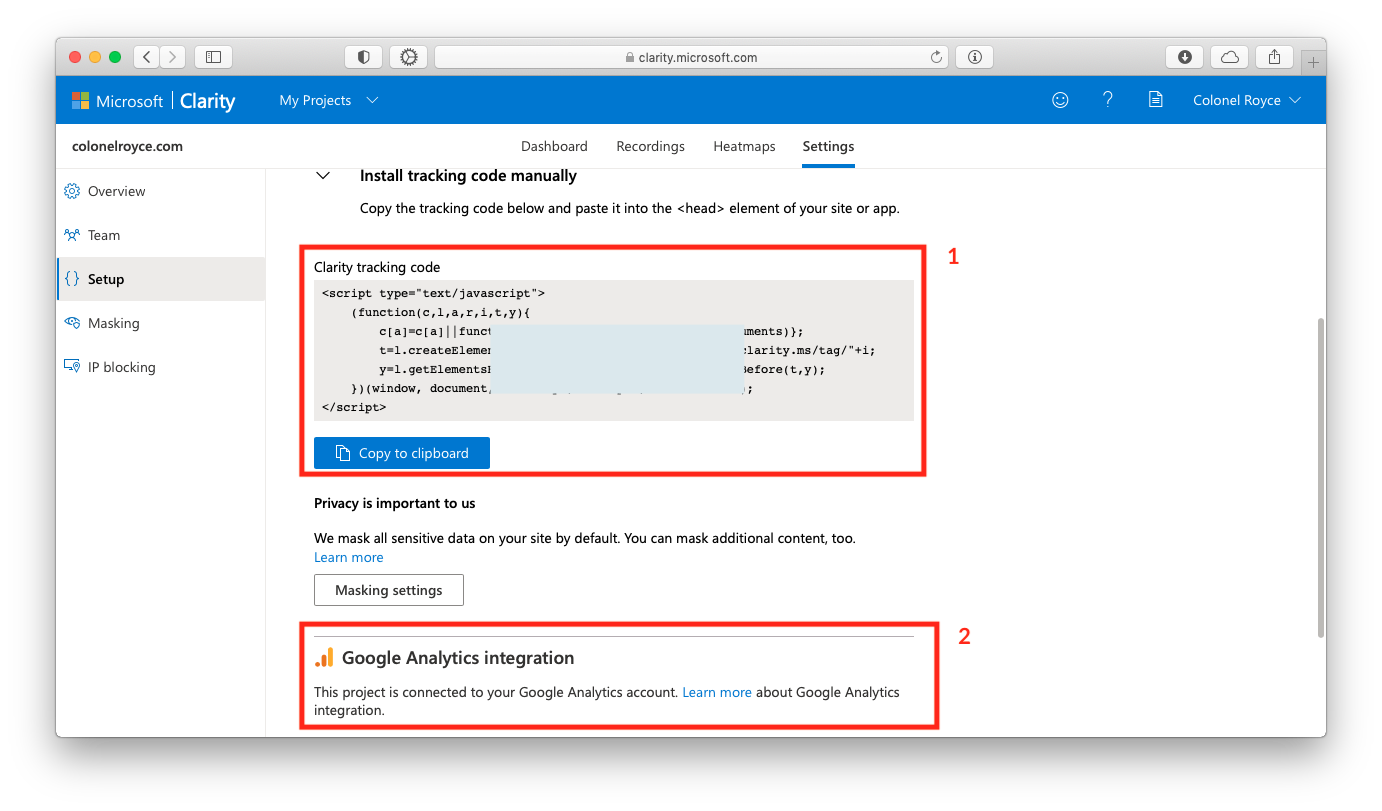
Then go to the Google Analytics integration section (2). There's only one button. Click it, and if you registered through Google as suggested, just confirm access in the pop-up window.
Viewing stats
The service has three main sections: Dashboard, Recordings, and Heat Maps.

- Dashboard provides aggregated user data through charts
- Recordings, where screen recordings reside
- Heatmaps, has scroll & clicks heat maps
The Dashboard provides aggregated user data through charts.
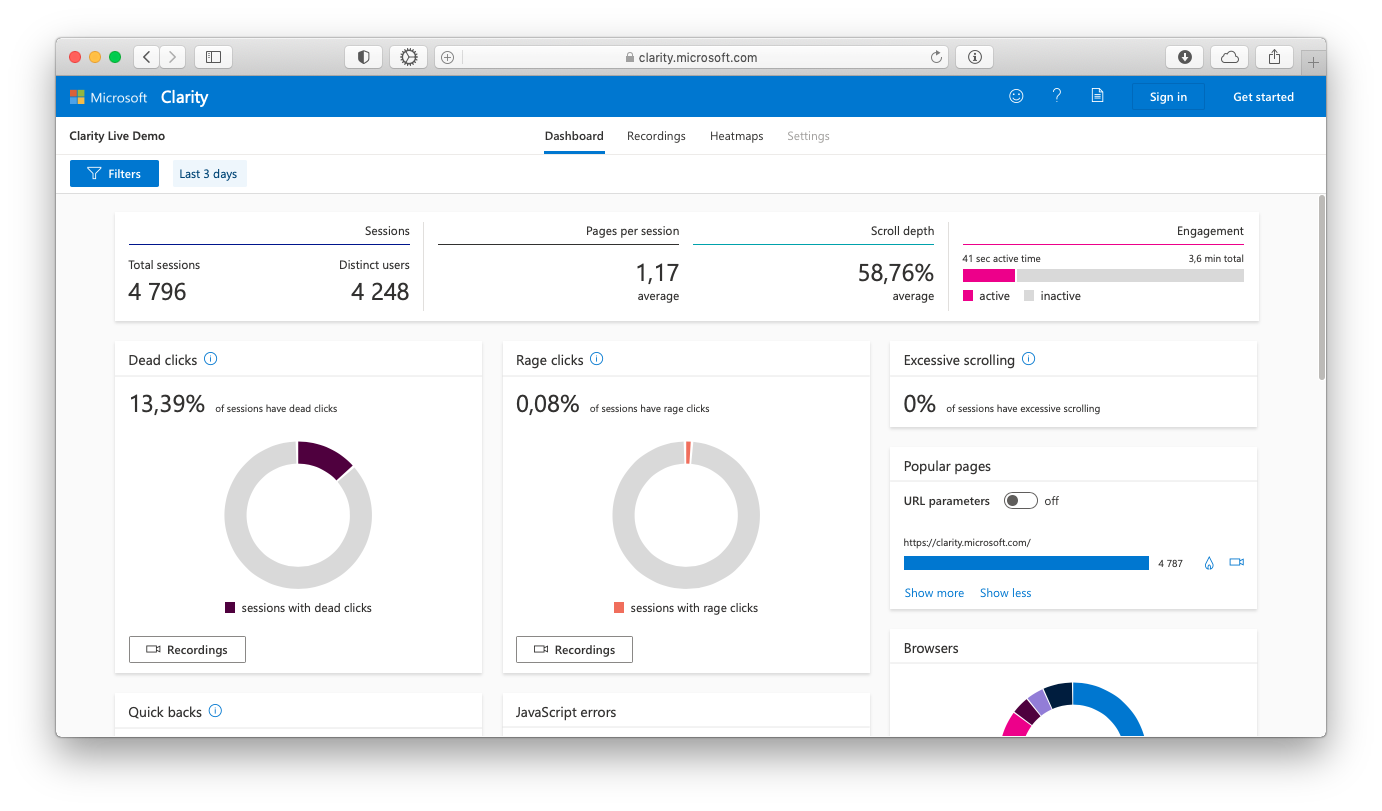
Session and user counts, geography, browsers, and traffic sources are a no-brainer. That's what everything else means:
- Scroll depth — the percentage of the page that users typically view. The higher, the better.
- Engagement — the amount of time users are actively interacting with content versus being distracted. The higher 'active', the better.
- Dead clicks — the percentage of sessions where users clicked on non-interactive elements or elements that don't work. The lower, the better.
- Rage clicks — sessions where users clicked repeatedly in the same place, often out of frustration because something did not work. The lower, the better.
- Excessive scrolling — sessions where users scrolled too fast, often due to poor content or UX. The lower, the better.
- Quick backs — sessions where users clicked a link and quickly returned to the previous page. The lower, the better.
- JavaScript errors — the number of sessions where JS problems occurred. The lower the better.
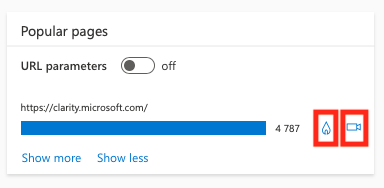
Some rows contain icons: A flame icon opens heatmaps for the parameter (e.g. clicks from visitors in Frankfurt). A camera icon shows session recordings related to the parameter (e.g., only sessions with JavaScript errors).
Applying filters
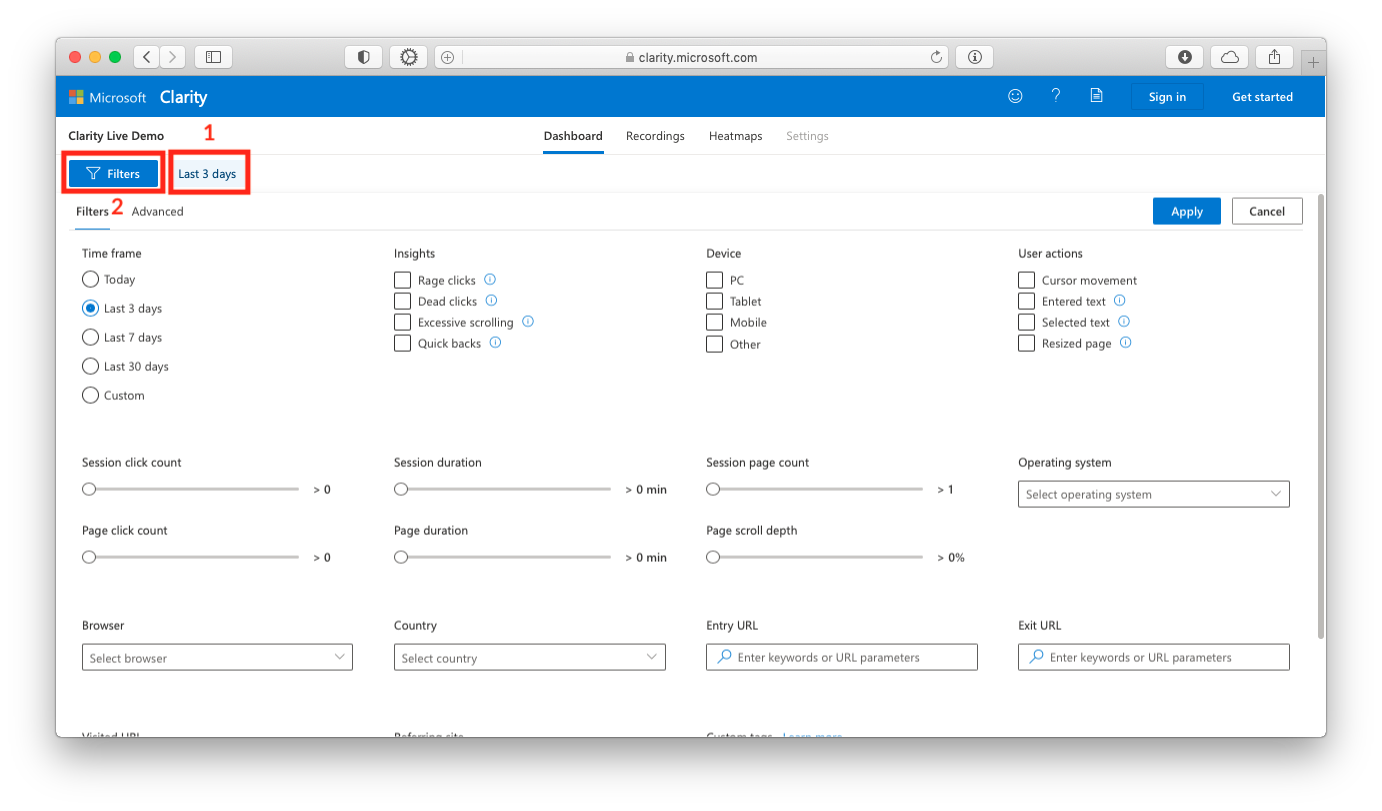
Filters are available in each of the three sections. They help you sort data by time period (1) and session parameters (2) such as dead clicks, duration, source, scroll depth, and more. At the time of this writing, the Filters and Advanced tabs didn't differ in functionality, just in design. Oh, Microsoft.
Exploring screen recordings
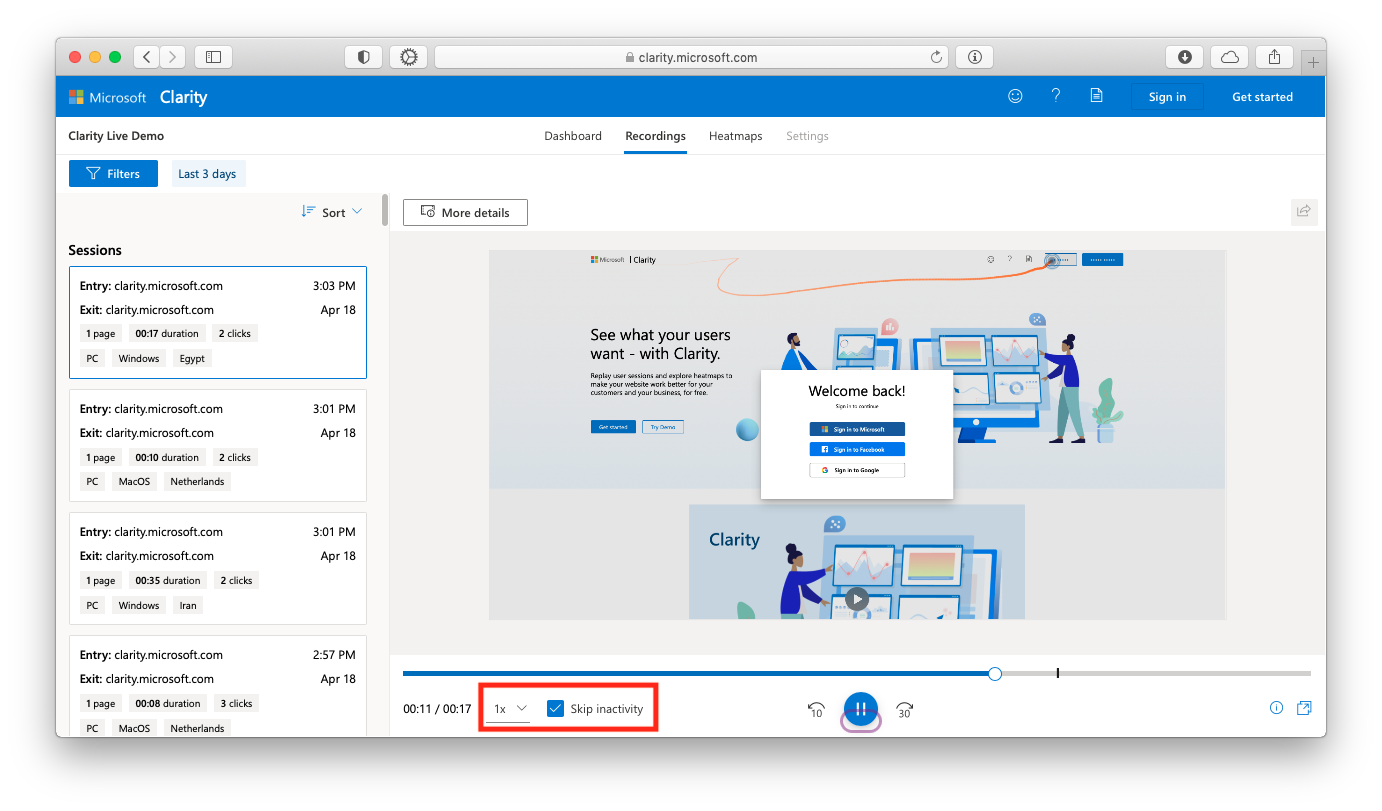
This section is straightforward: a chronological list of sessions on the left, with a video player on the right. Each session includes date and time, entry and exit pages, number of pages viewed, duration, clicks, device type, and user location. Select a session, press play, and watch an exact replay of the user's visit. You'll see cursor movements, page scrolling, text highlighting, and button clicks.
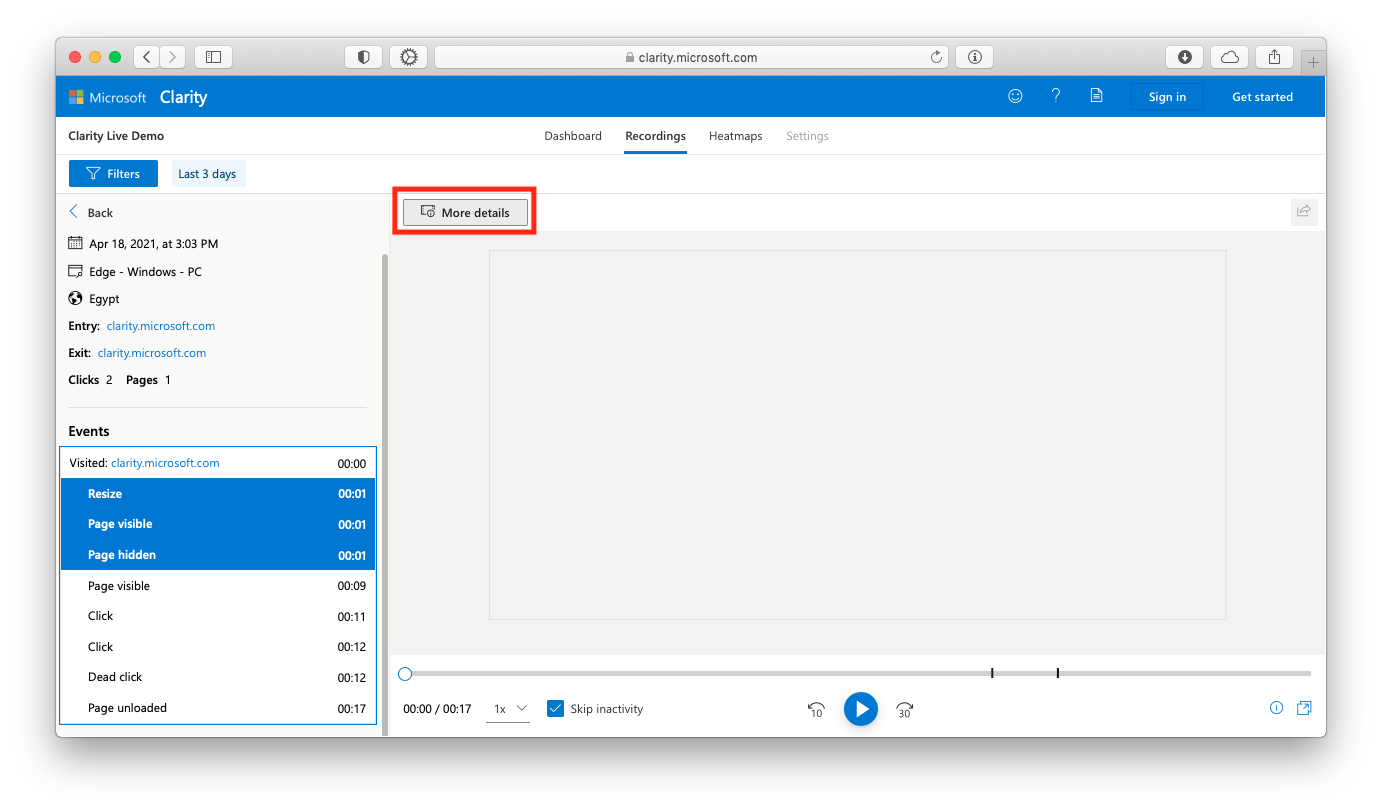
Save time by enabling Skip Inactivity to automatically fast-forward through idle time. You can also adjust the playback speed from 0.25x to 12x. Click More Details to open a detailed text log of the session, including all actions with timestamps..
Click Click More details to open a detailed text log of the session, including all actions with timestamps.
Analyzing heatmaps
Heatmaps provide aggregated click and scroll data for each page. Enter a page URL (1) and select the device type (2). The page loads on the right, with the most clicked areas highlighted in red, less clicked in green, and rarely clicked in blue.
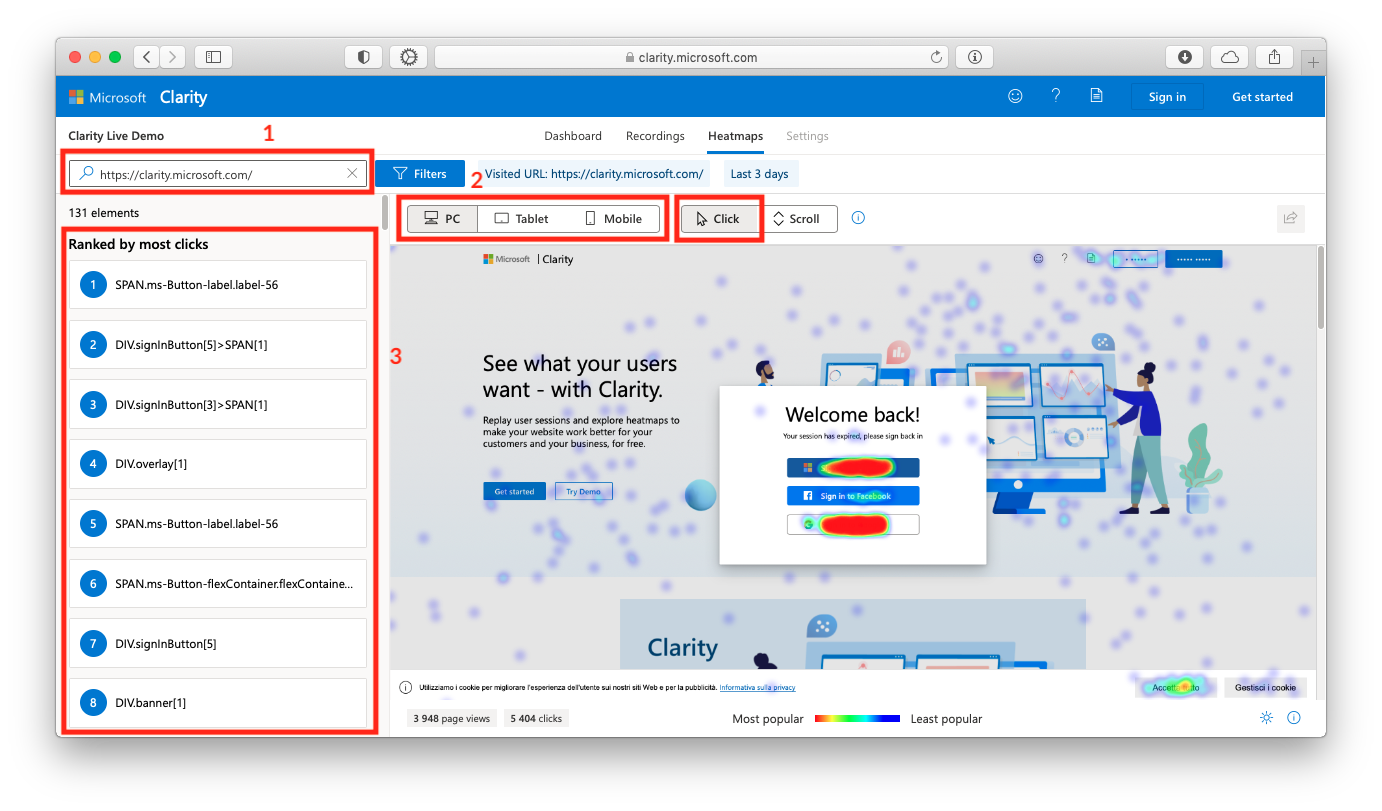
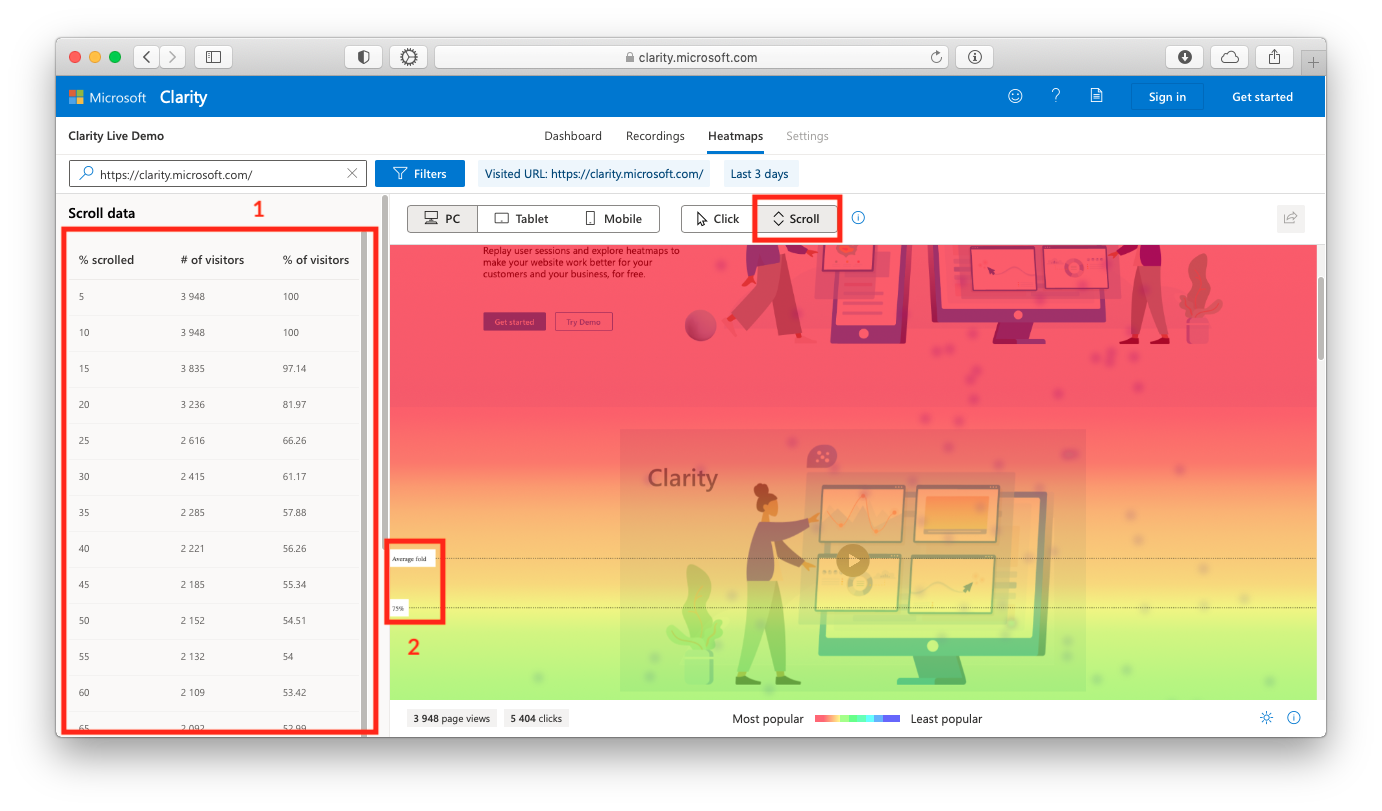
To analyze scroll depth, select Scroll. Areas visited by all users are highlighted in red, with a gradient toward blue for less visited sections. The service also highlights breakpoints (2) that show how far 95%, 75%, 50%, and 25% of users scroll.
More detailed data is available on the left (1), broken down into 5% increments, showing the absolute and relative number of readers who reached each point.
Sharing access
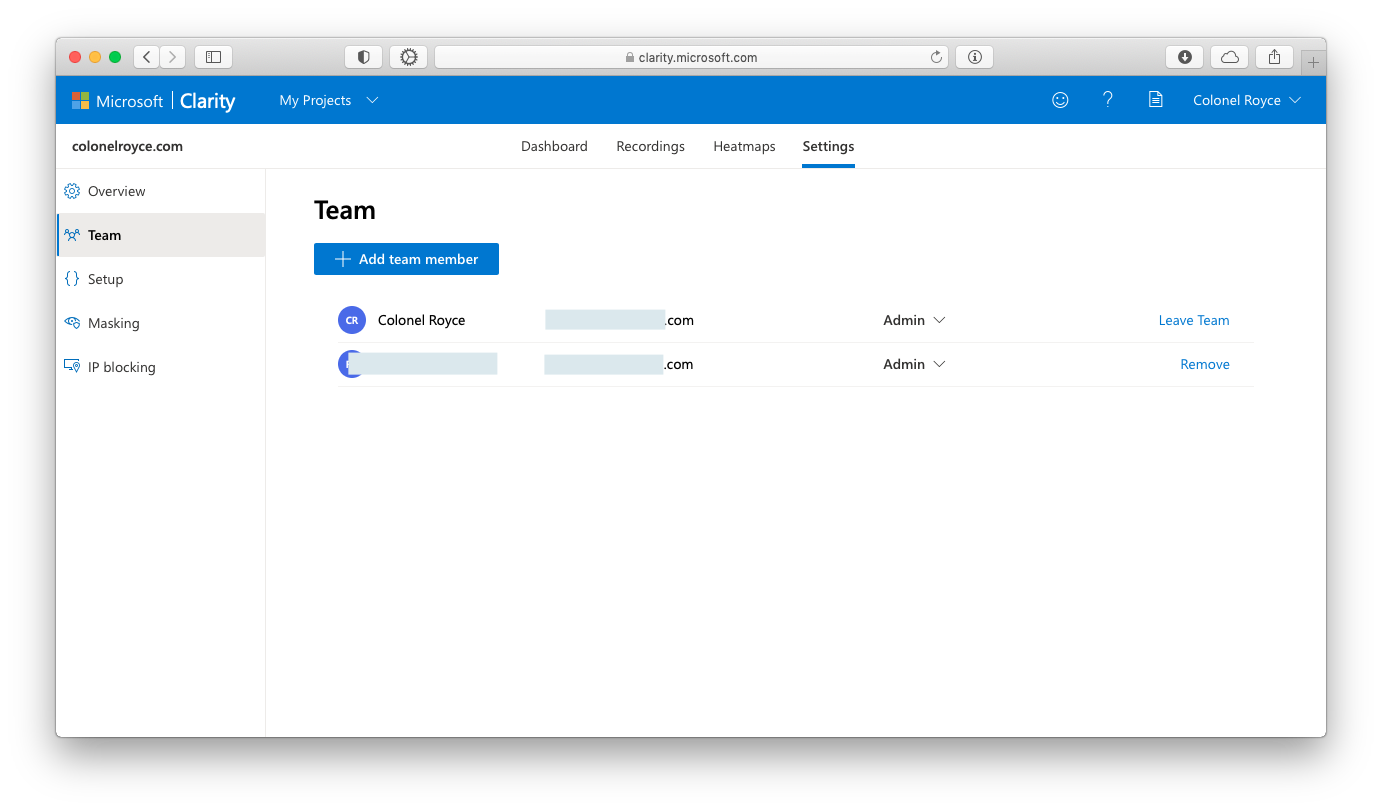
Invite team members from the Team tab in Settings. Enter their email address and assign them one of two levels of access: either admin, with full access, including the ability to delete projects, or member, with access to everything except project, team, and account management.
Masking sensitive data
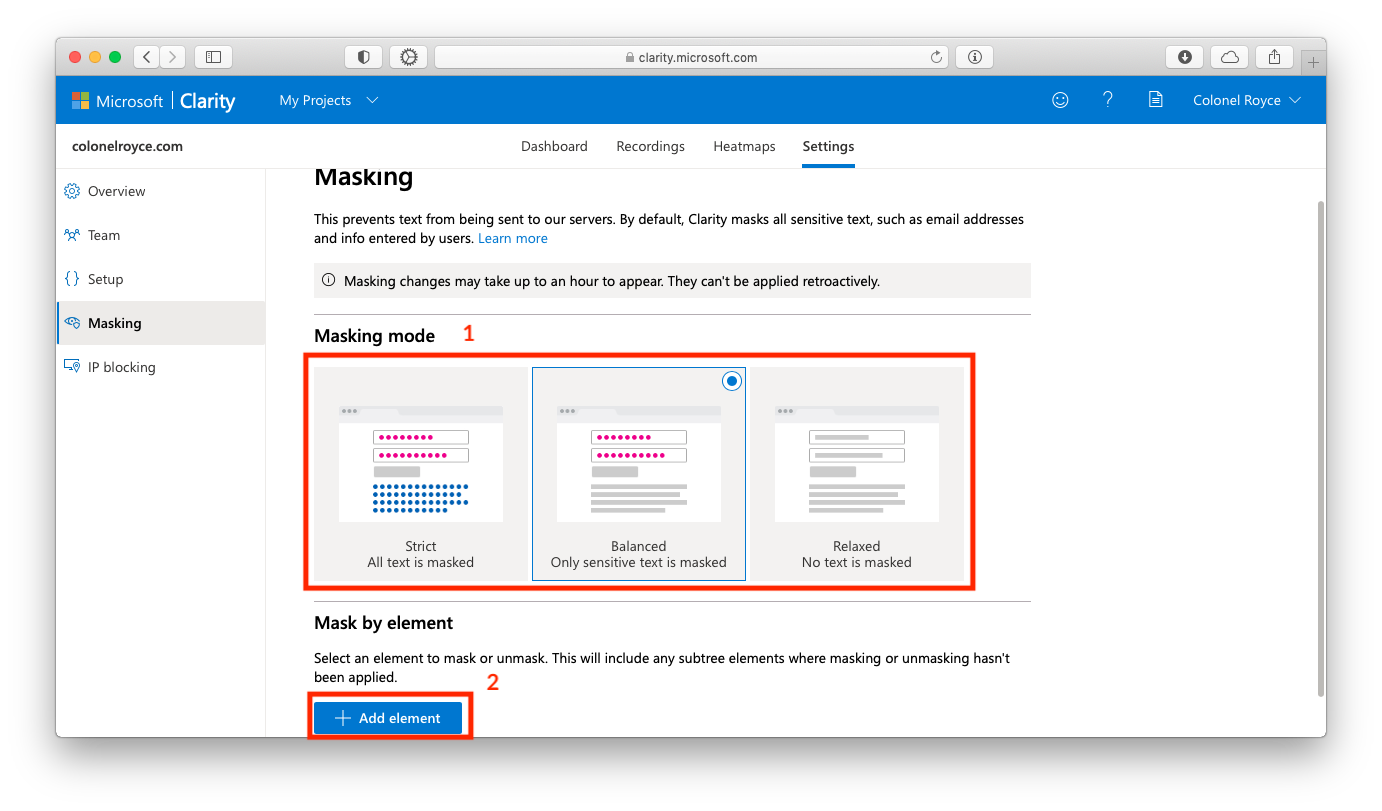
In the settings under the Masking tab there's an important parameter (1): what content Clarity won't record. This is especially useful if your site has input fields such as login forms, passwords, comments, and so on. By default, the system uses a medium masking mode — it automatically detects sensitive data and replaces it with dots in session records. Strict mode goes a step further and masks all text. Of course, you can disable masking altogether if you wish.
Additionally, you can specify (2) a CSS selector (such as a class or ID) for a specific element where Clarity should always hide the data.
Important: You must ensure that your site's privacy policy discloses data collection via Clarity (and, if you're in the EU, provides an option to opt out). Also, Clarity cannot be used on sites that handle medical, financial, or government data — i's against their policies.