Google Looker Studio (ex-Data Studio) Guide. Get business insights with data analysis
Experienced users make supercharged personal dashboards in Looker Studio, but newbies find it a bit complex. It's not that hard to get started. With a bit of practice, you'll learn how to track all your marketing and business metrics in one place in no time. I've broken down how to use Data Studio into a guide.
UPD: This article was first published in 2019 as a Google Data Studio Guide; in 2022, Data Studio changed its name to Looker Studio. The guide has been updated with fresh screenshots in 2025.
What's Google Looker Studio? Why is it useful?
Looker Studio is an analytics tool that helps you track KPIs and generate reports. It's a convenient way to collect data from multiple sources in one place, saving you time and effort. You can mix Google Analytics, CRM, social media, and Google Sheets data in a single report.
Looker Studio is especially useful for business owners and marketers who need in-depth analysis and automated report generation (for internal or external use), comparing statistics from different channels, management processes, or ad campaigns. With Looker Studio, you can get a helicopter view of your performance without the need to inspect each service separately.
Getting started with Looker Studio
Creating a report
To get started with Looker Studio, sign in to your Google Account on the main page, and you'll be taken to the homepage. It's empty now, but will later host your reports and data sources. As this is your first time using Looker Studio, after clicking 'Create' you'll be asked to accept the service's terms of use and subscribe to its newsletter.
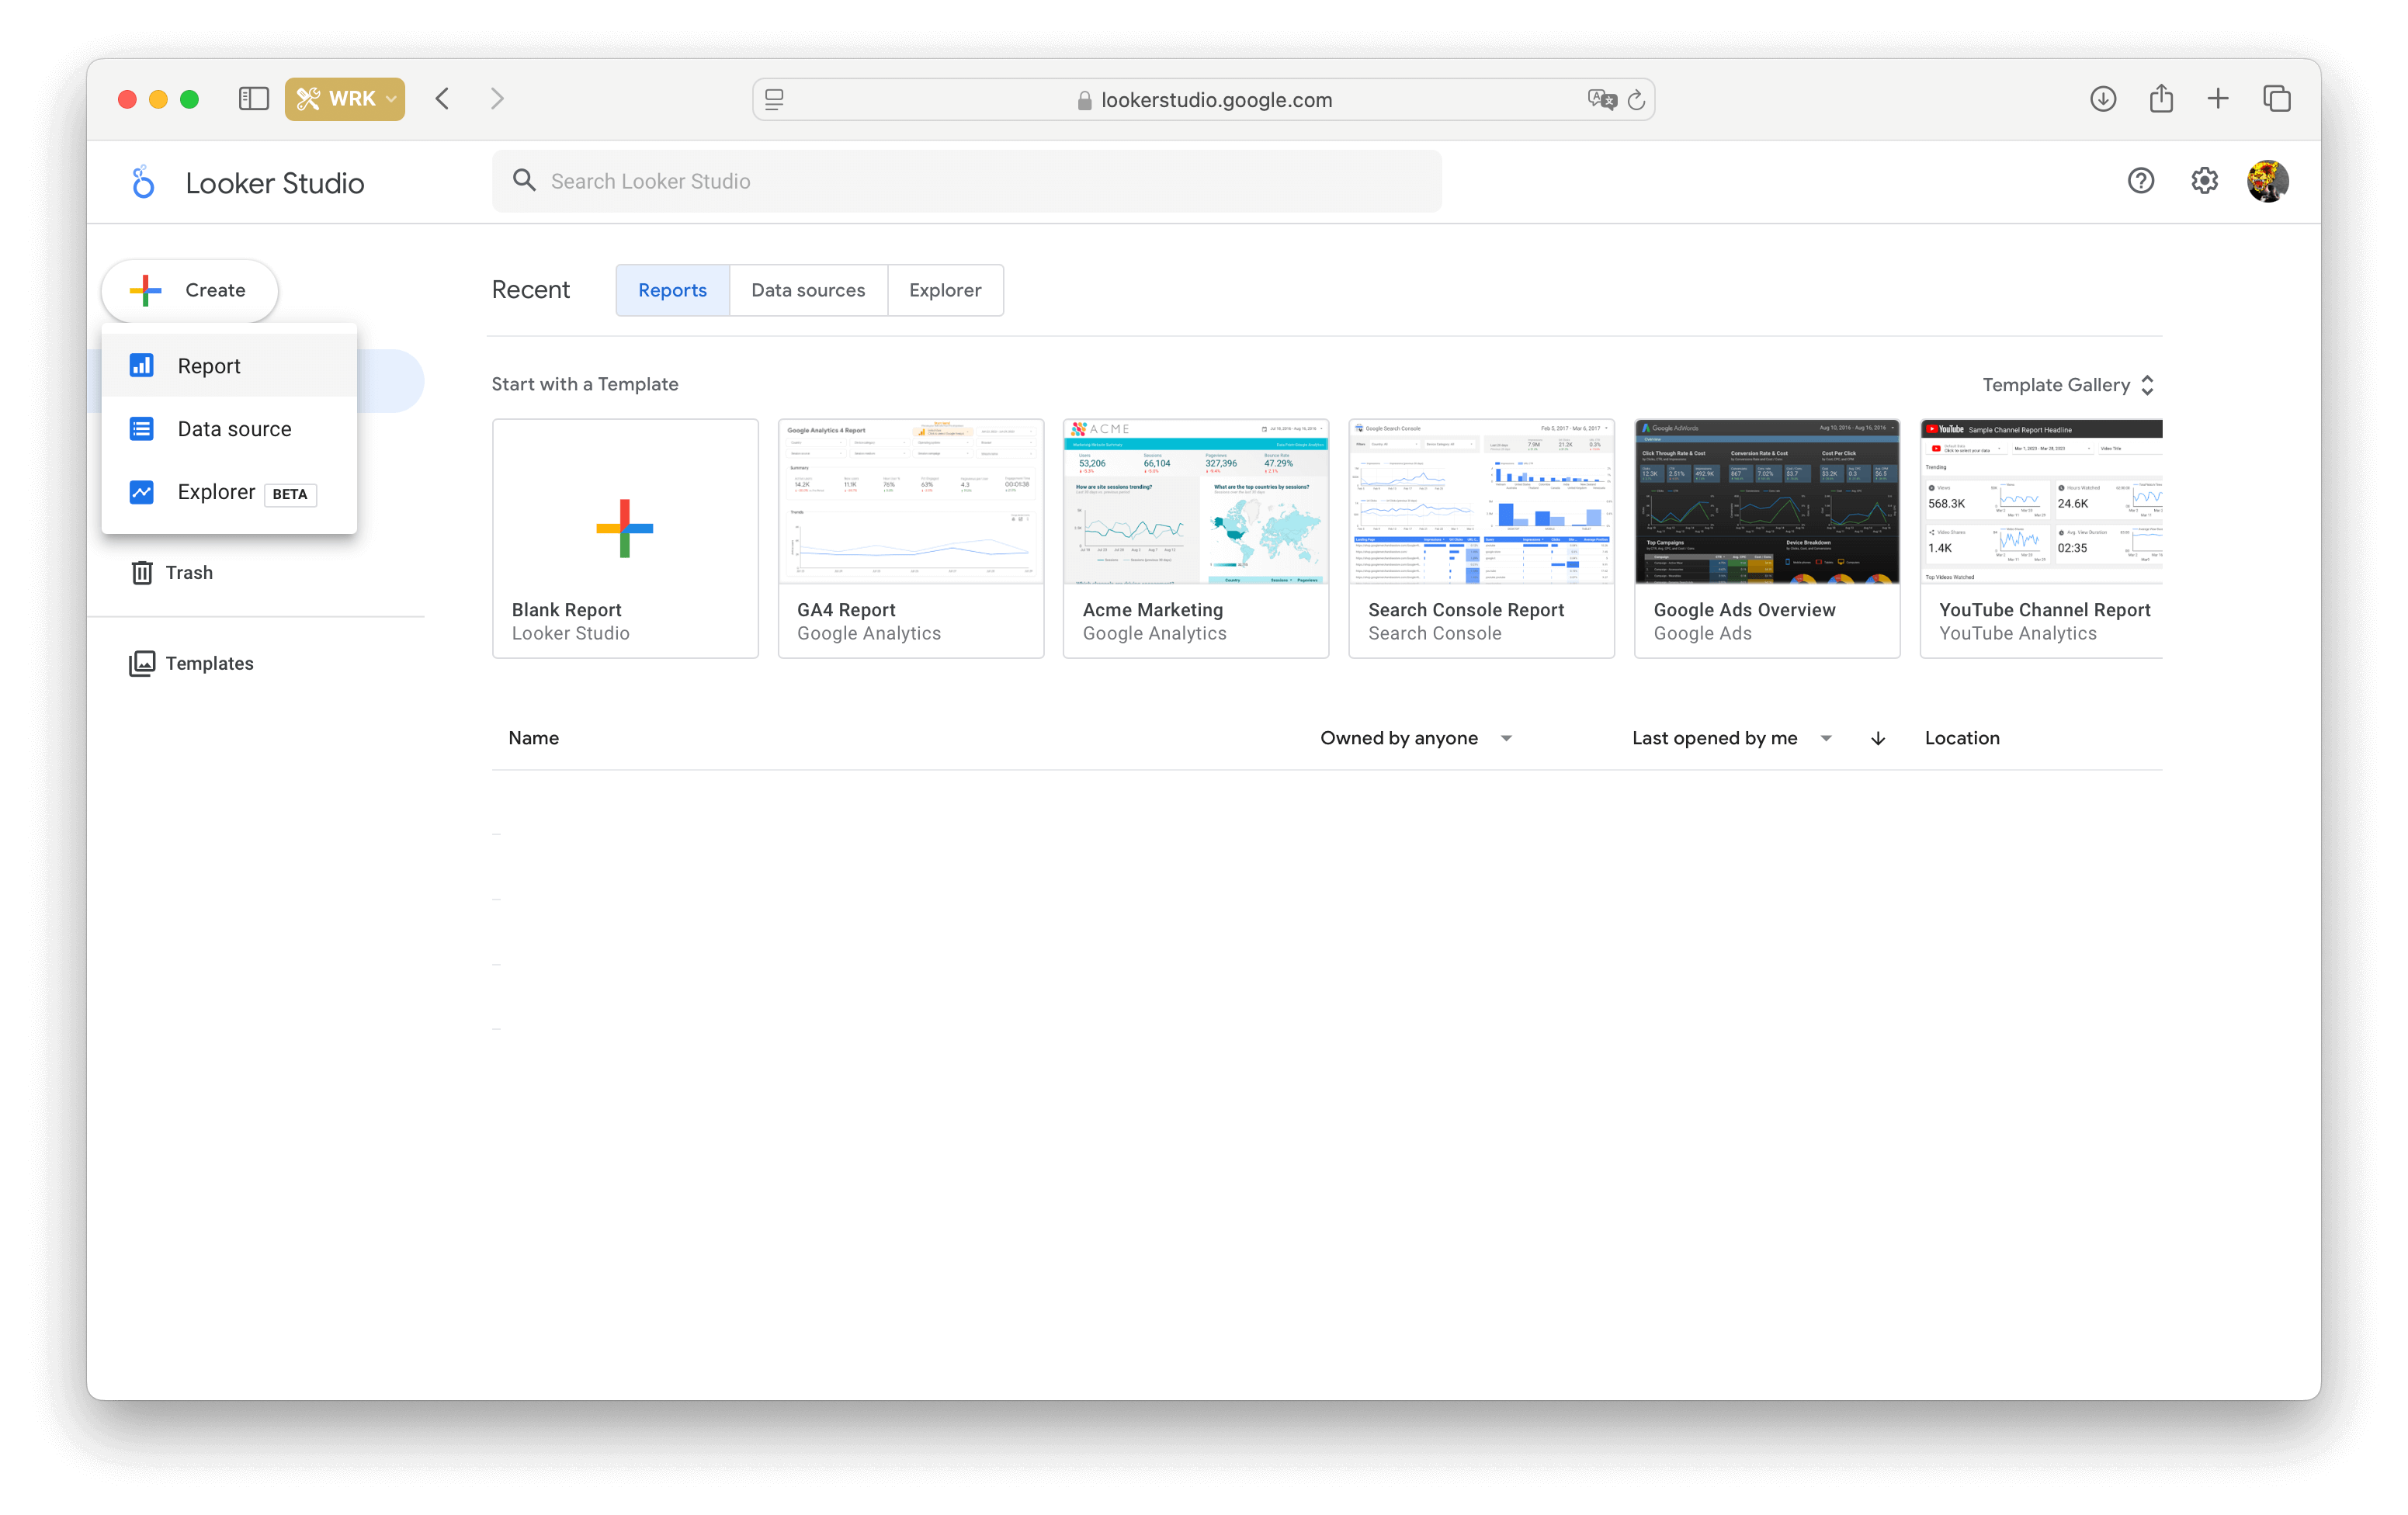
After clicking 'Done,' you'll need to tap 'Create' again. This time, you'll be taken to an empty template where you can choose your data sources.
On the 'My data sources' tab, you'll see all the connected data sources. Since you haven't added any yet, Google suggests that you connect a service with live data or select one of the test datasets — all of which are labeled '[Sample]'. You can experiment with these or move on to connecting your own.
Connecting data sources
A 'data source' is a specific set of information from another service. When you connect Google Sheets, each spreadsheet is a separate data source. Similarly, if you connect Google Analytics, each view for a website will be a separate data source, and so on.
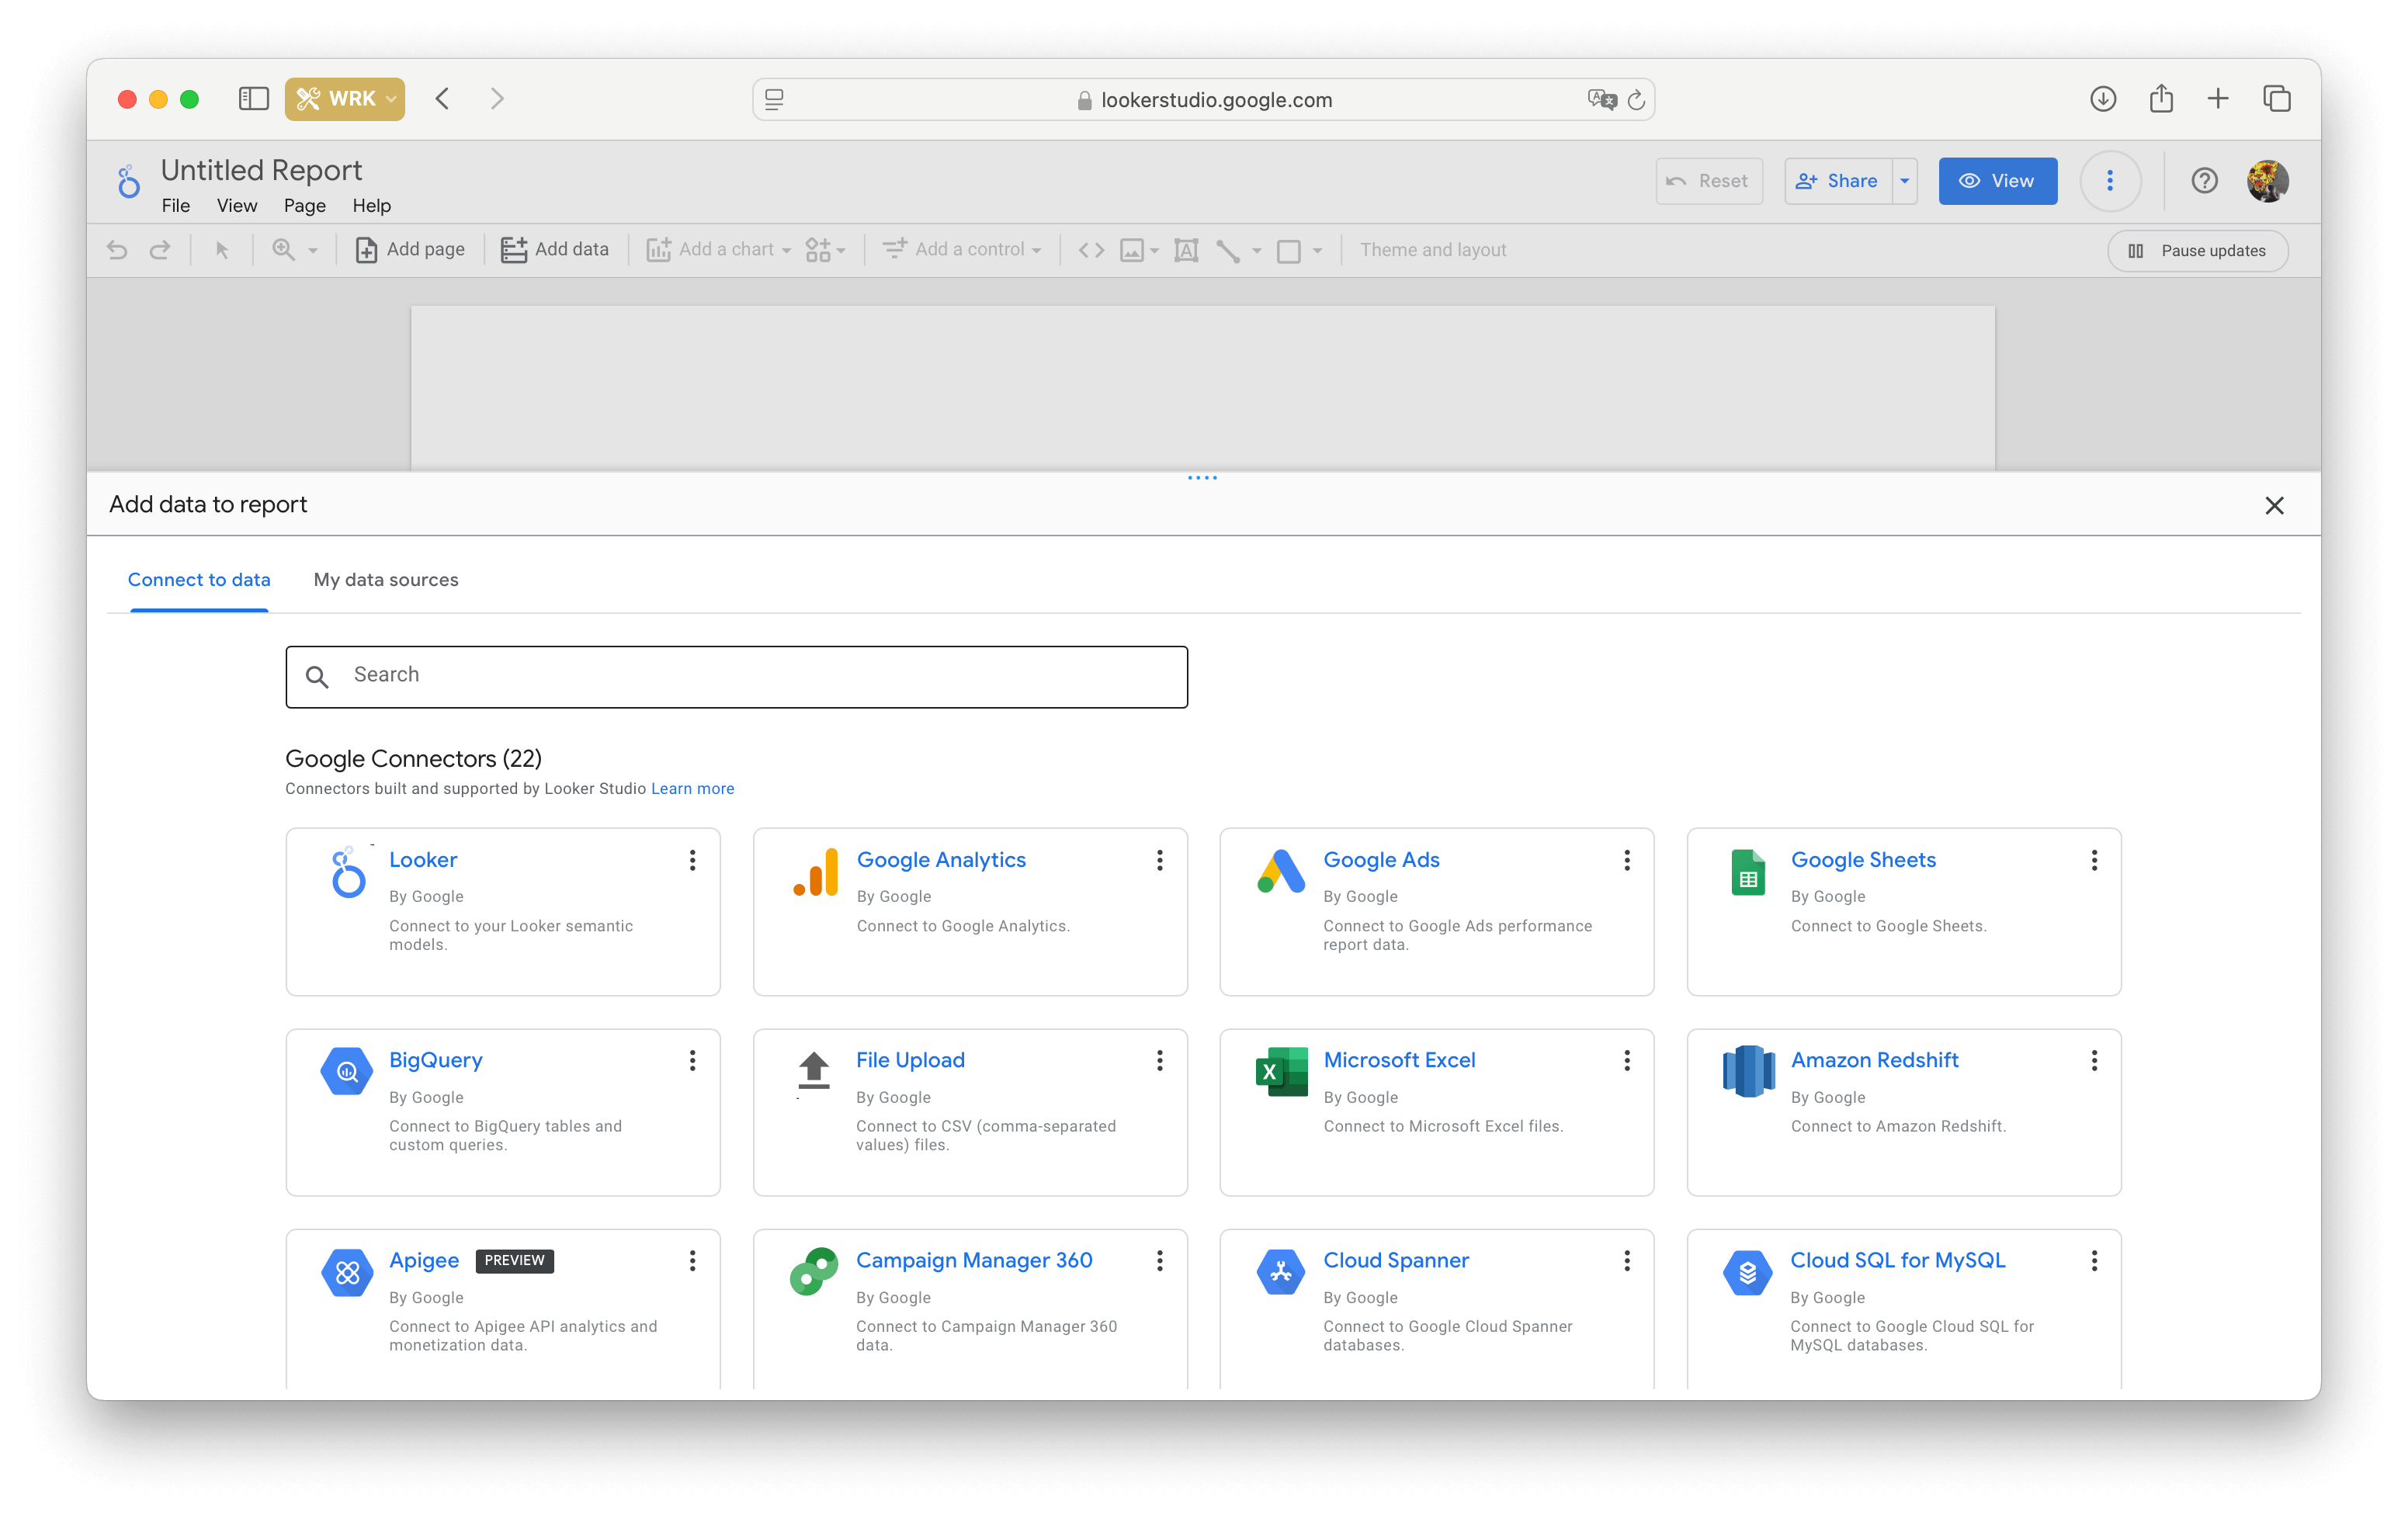
Looker Studio supports not only data from Google services, but also from external developers. You can connect to a MySQL database, a Facebook ad account, Salesforce, or any other service listed in the catalog.
If you don't find a suitable solution from Google or external developers in the catalog, you can develop one yourself.
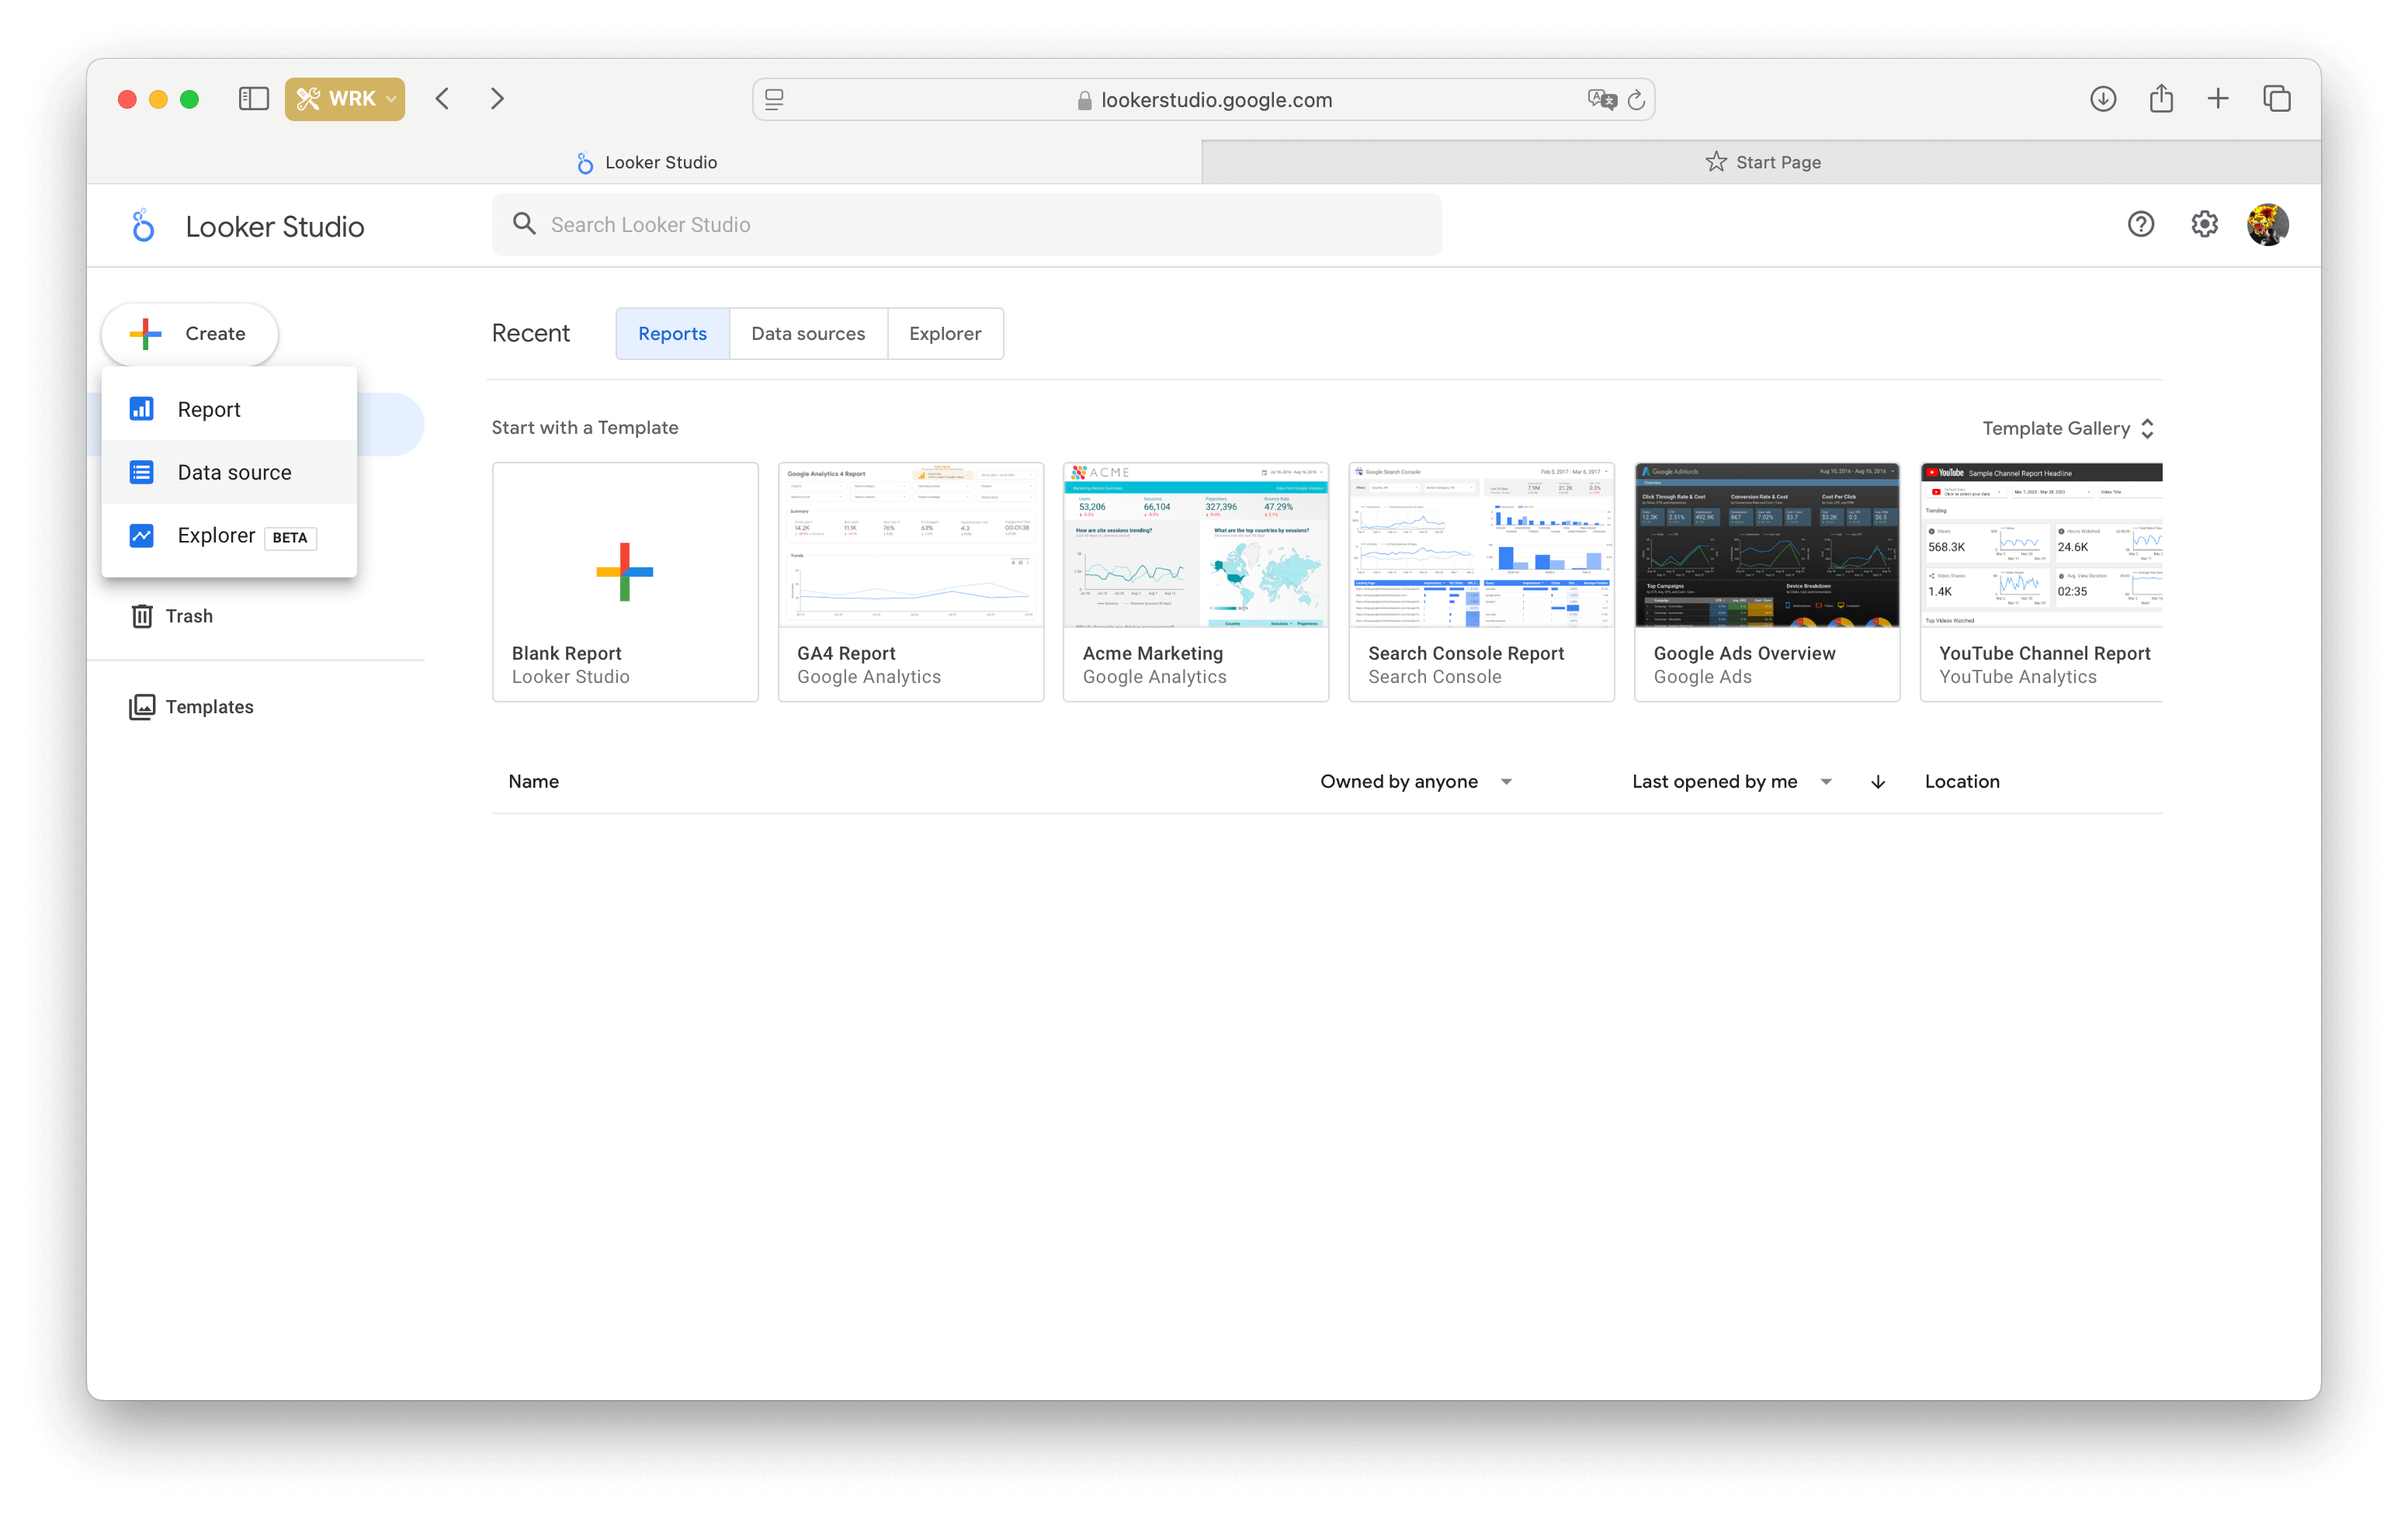
The other way to connect data sources is on the homepage. Just click on 'Create' and select 'Data Source'.
Click on the service, link it to your account, then select the data source and click 'Add'.
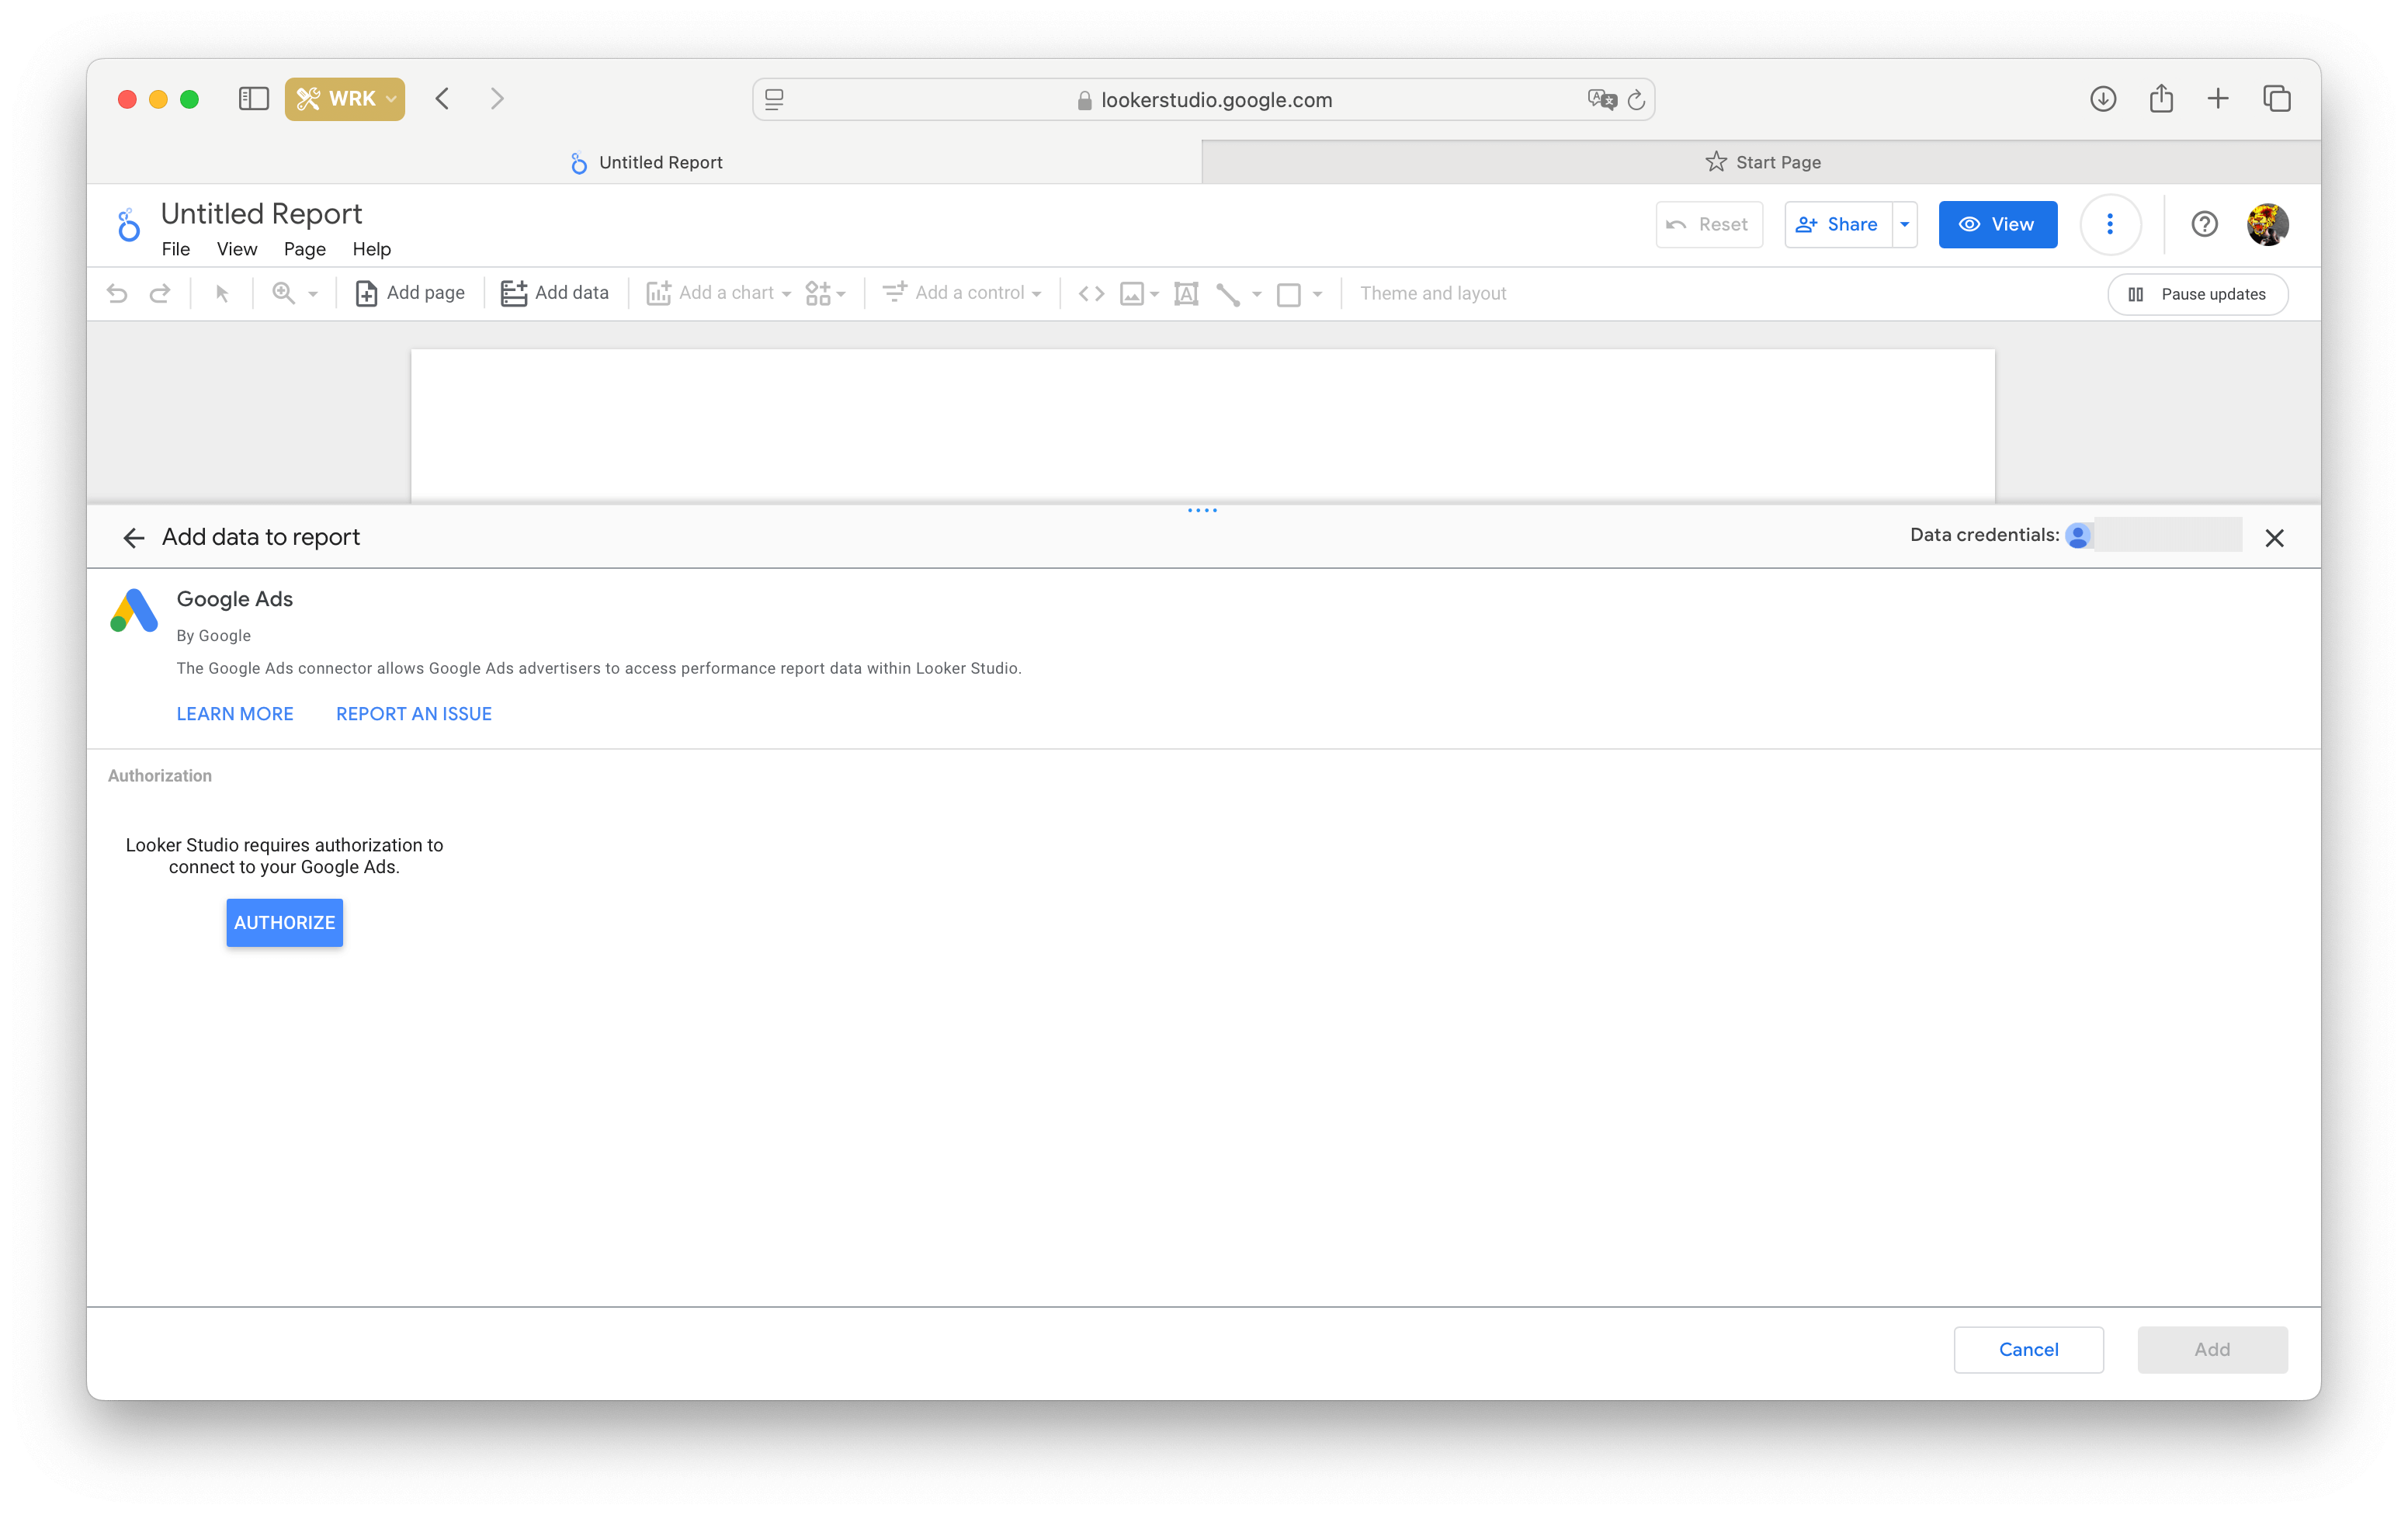
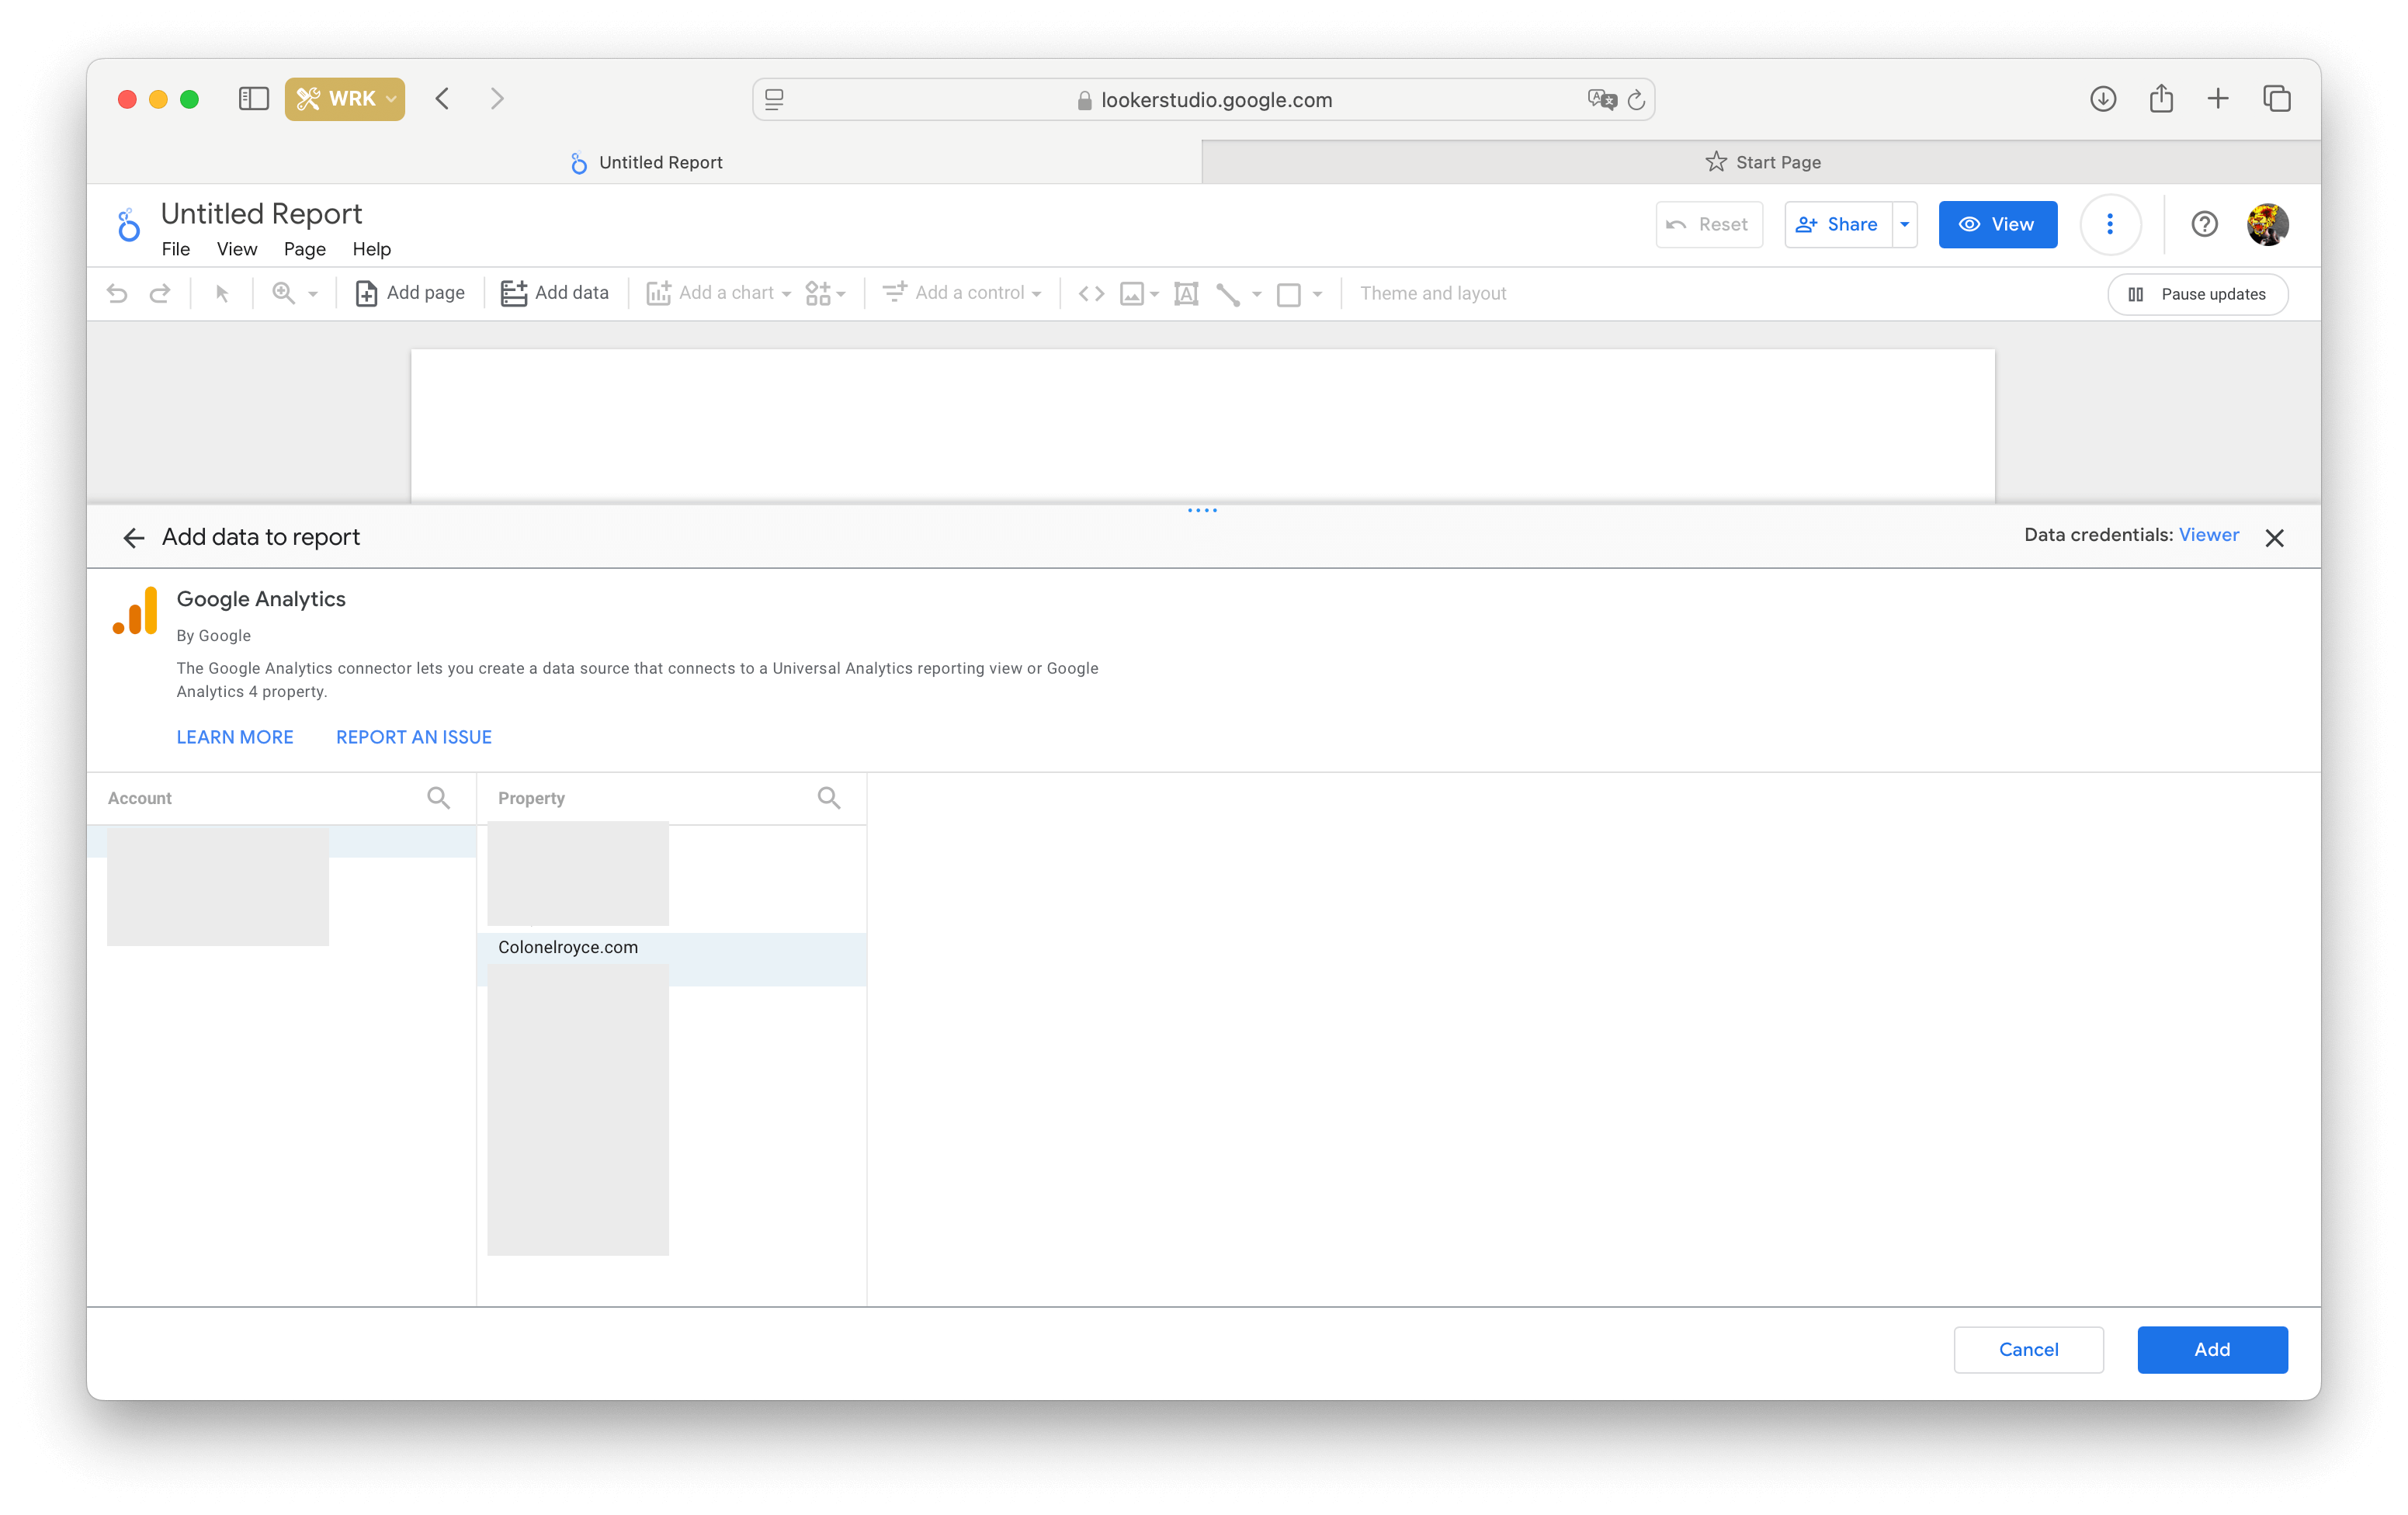
Each data source only needs to be connected to your account once, and you'll be able to reuse it again. You can add an unlimited number of data sources to a report.
Setting up the layout and theme
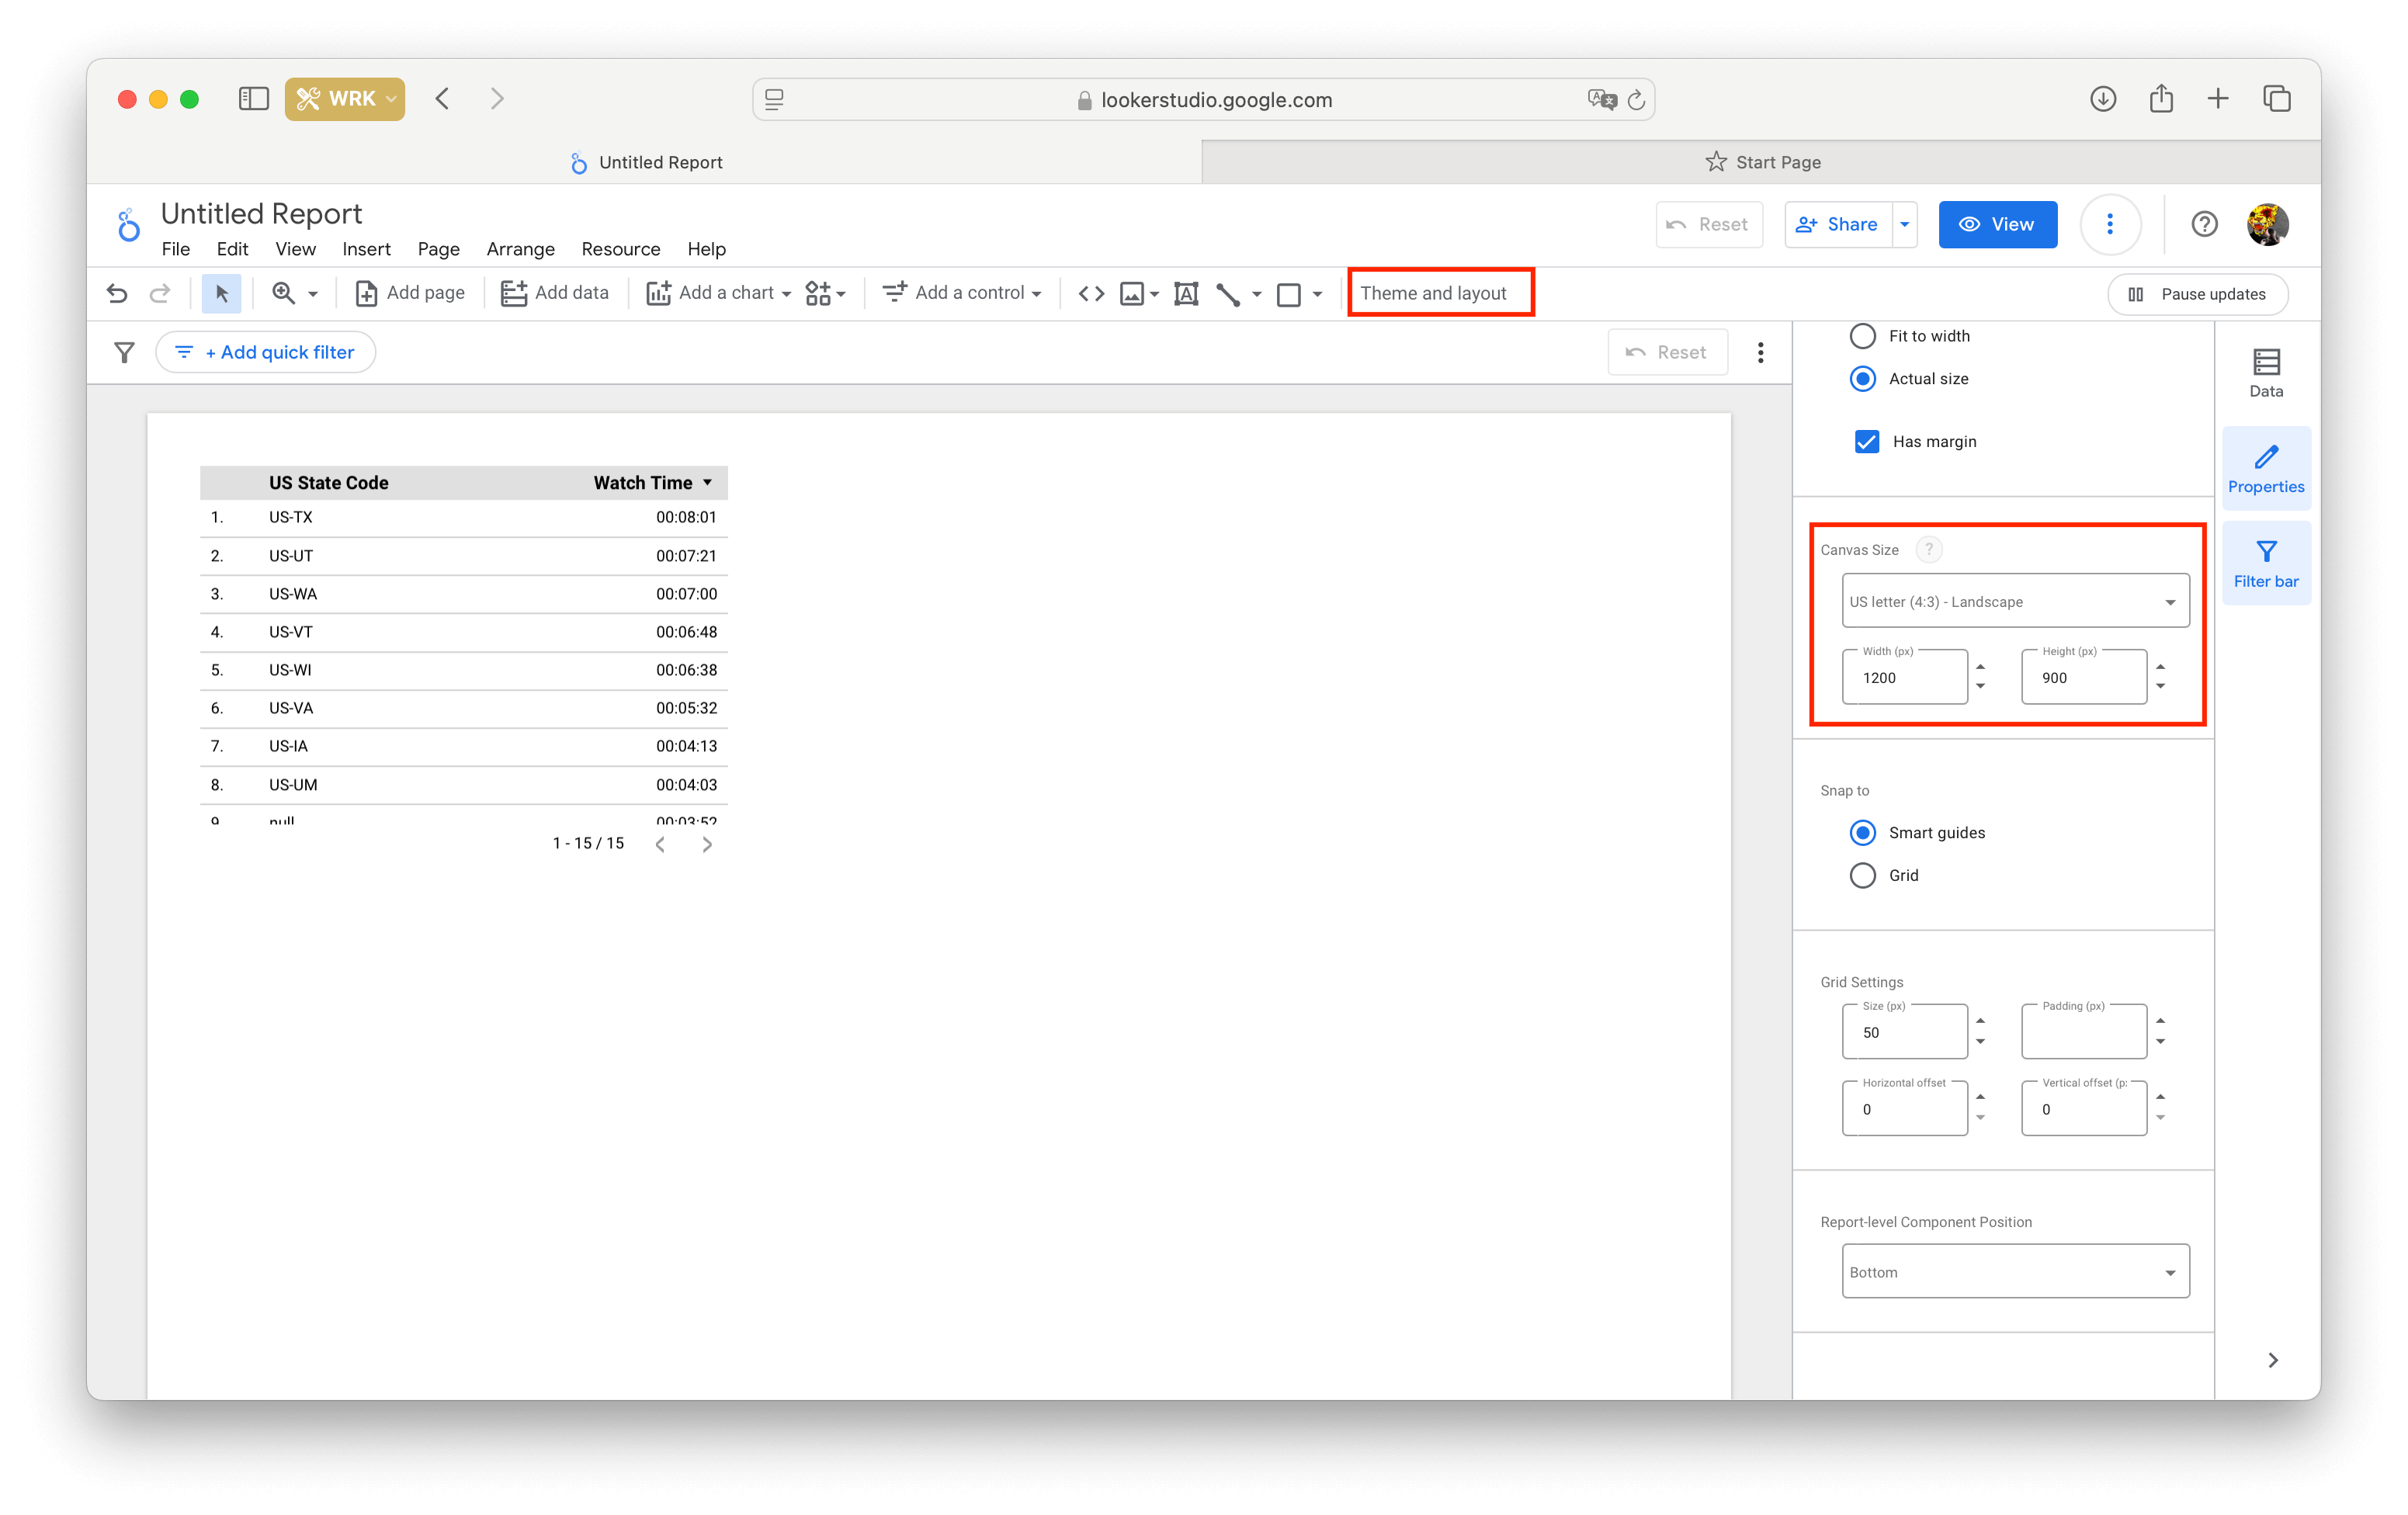
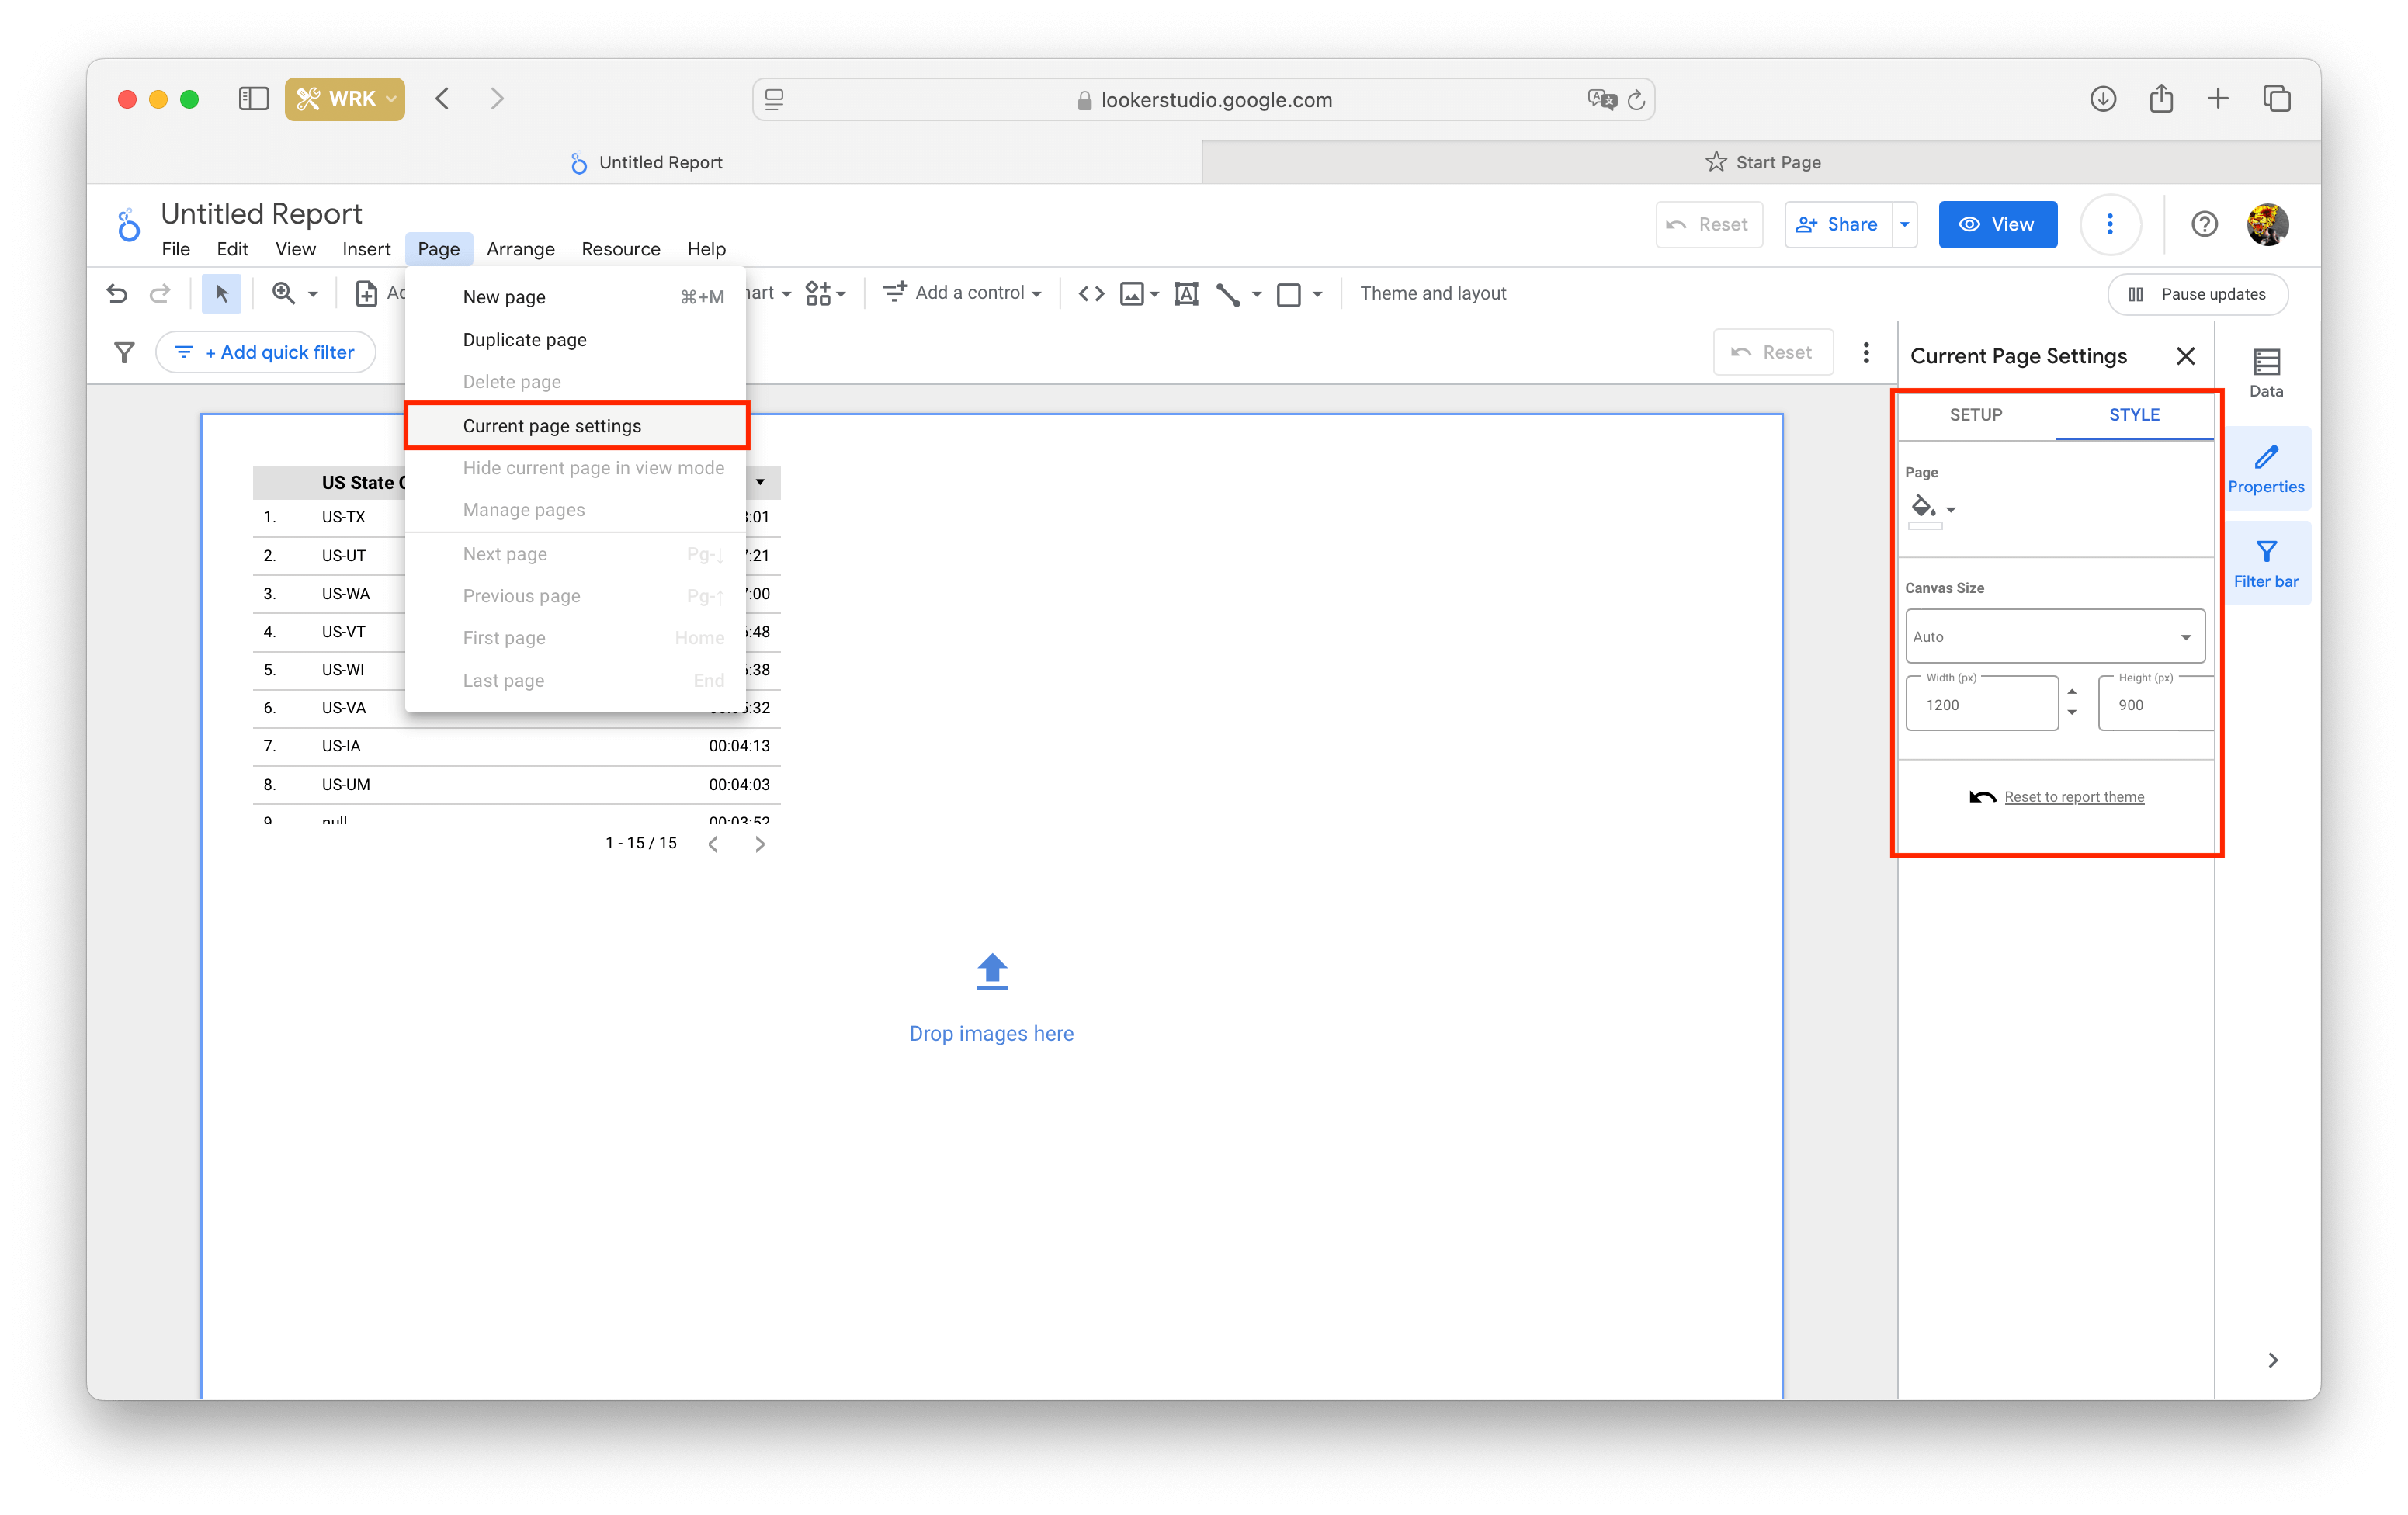
By default, Looker Studio creates a blank page with dimensions of 1200 x 900 pixels. You can set your own page size for the whole report in the 'Theme and layout' block or for a single page in the 'Current page settings' menu. The maximum width and height of a page cannot exceed 10 thousand pixels.
There, in the Theme and layout menu, you'll also find settings for the background color, grid size (it vanishes when you switch to View mode), and primary colors used in tables and charts.
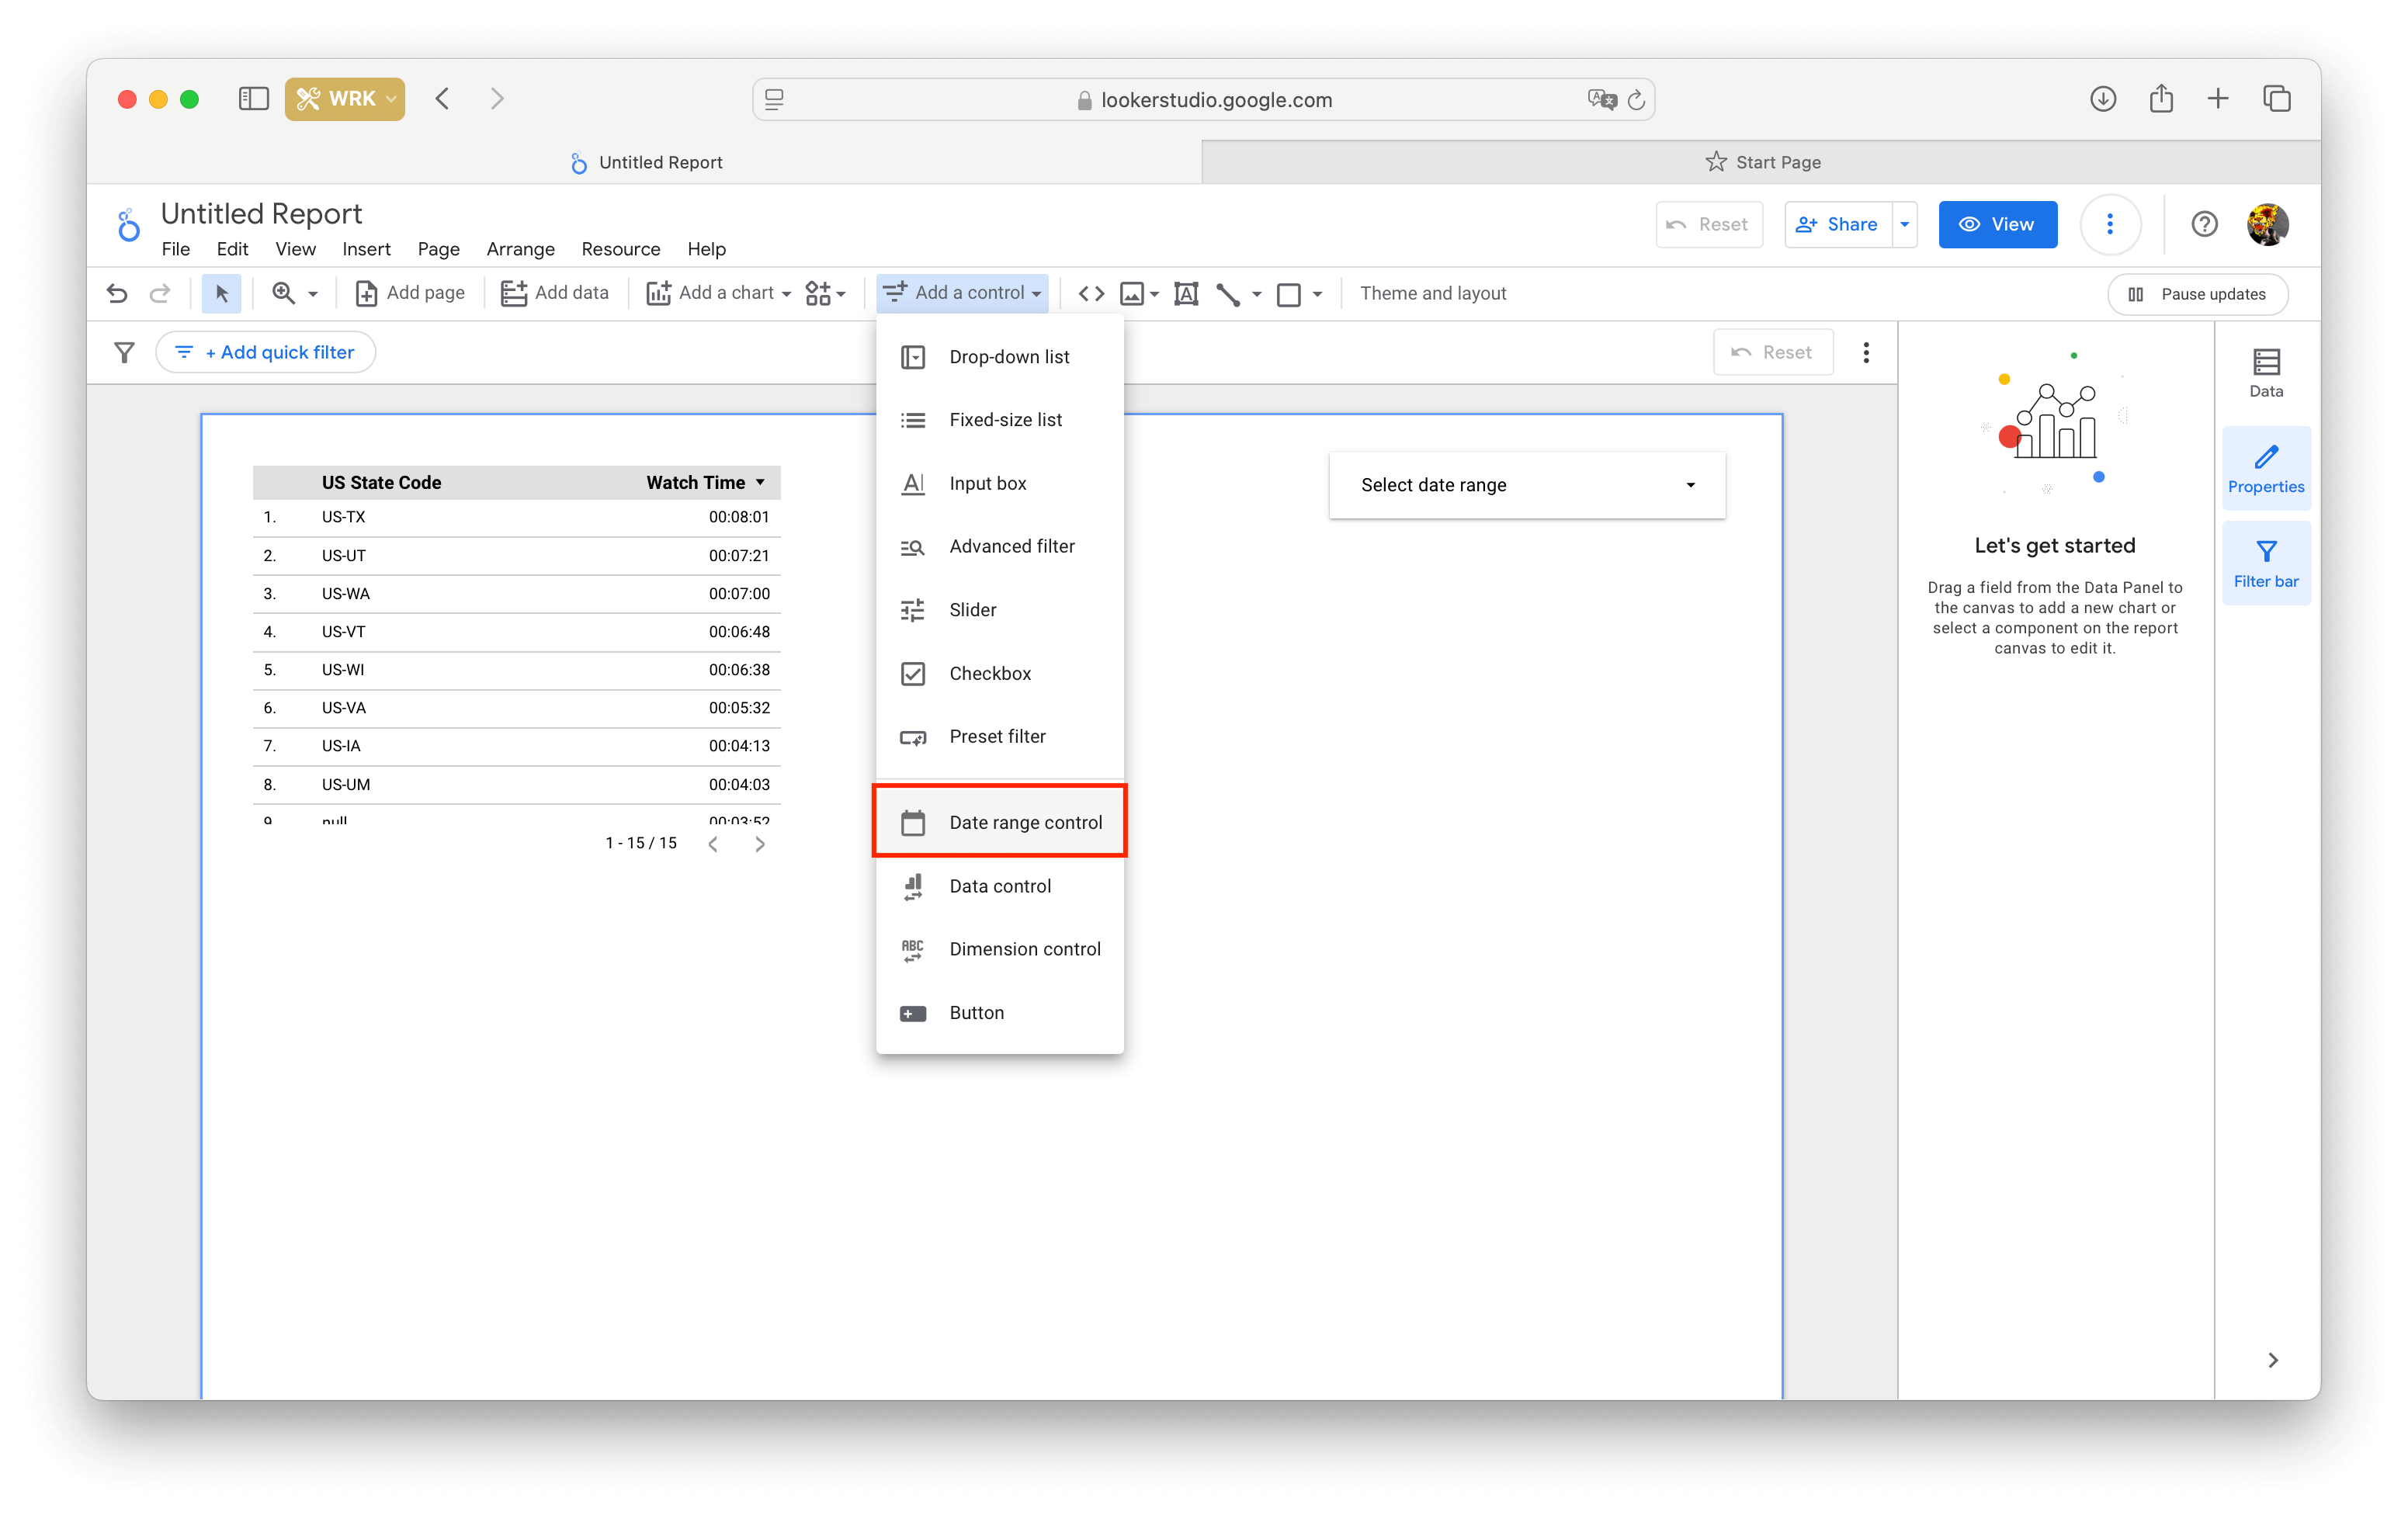
I recommend that you place a Date Range element on each page from the very beginning — it'll help you select the displayed time period for data. Click on the 'Add a control' button and add the Date Range Control anywhere you like.
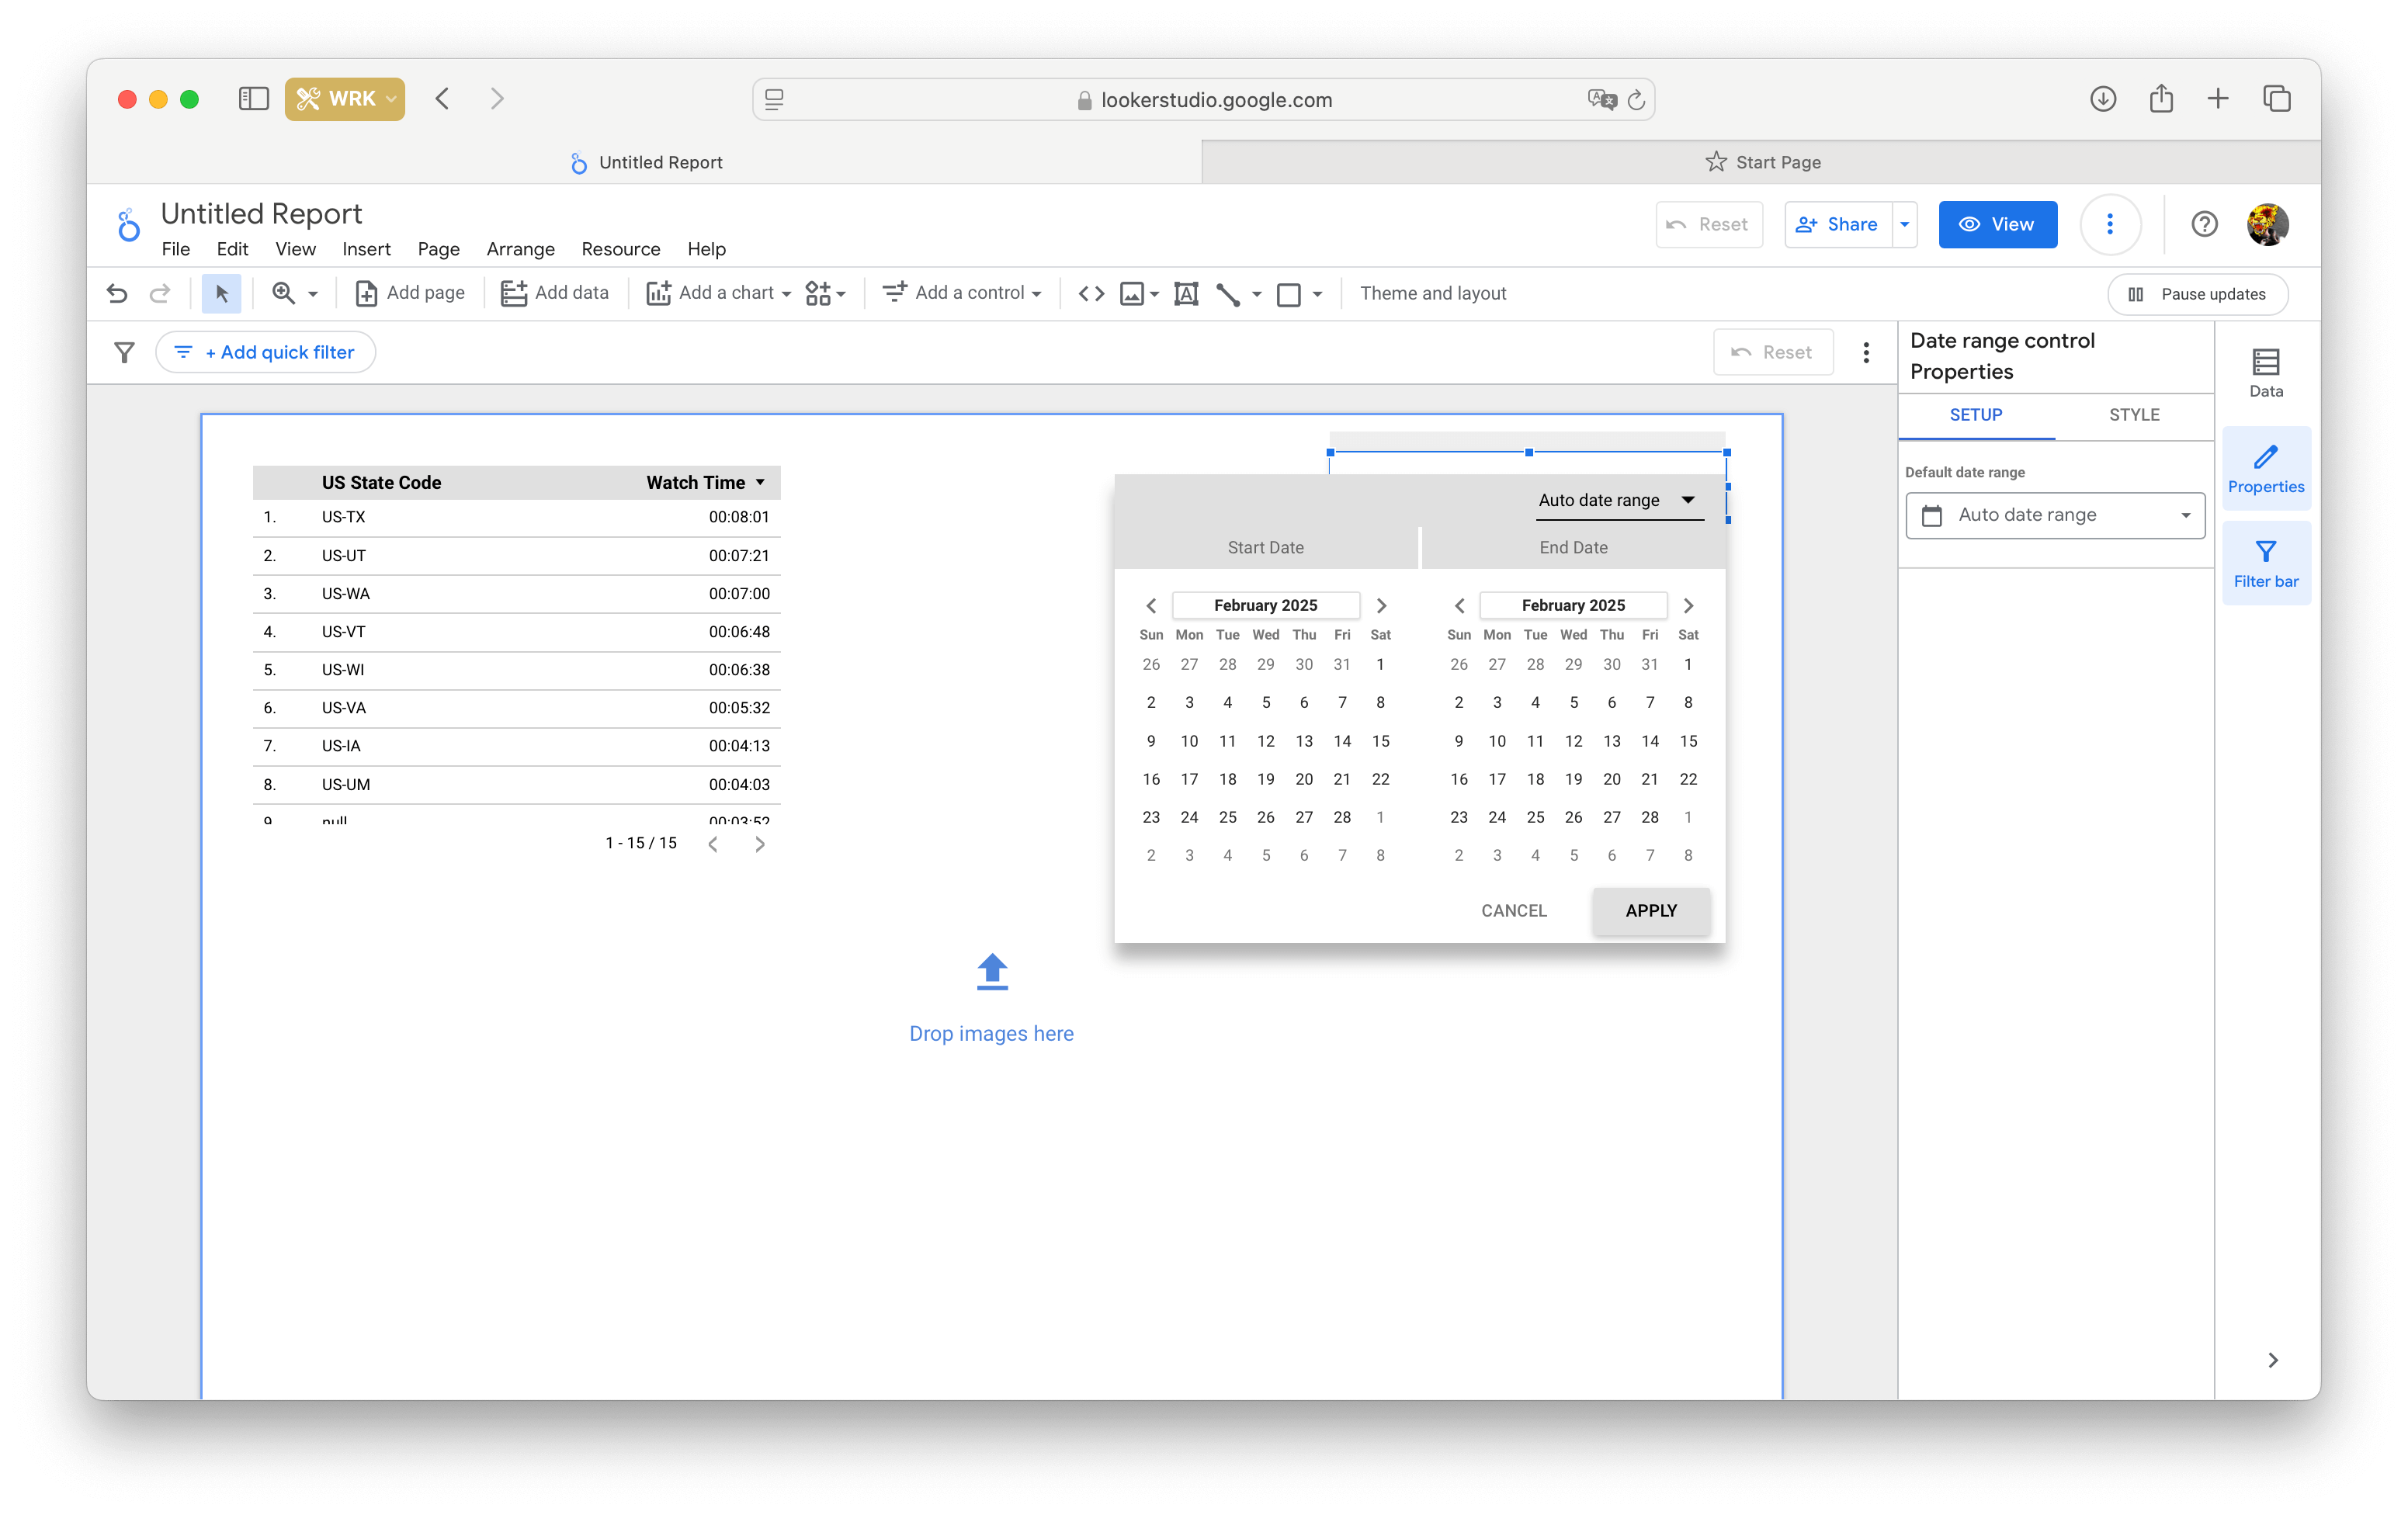
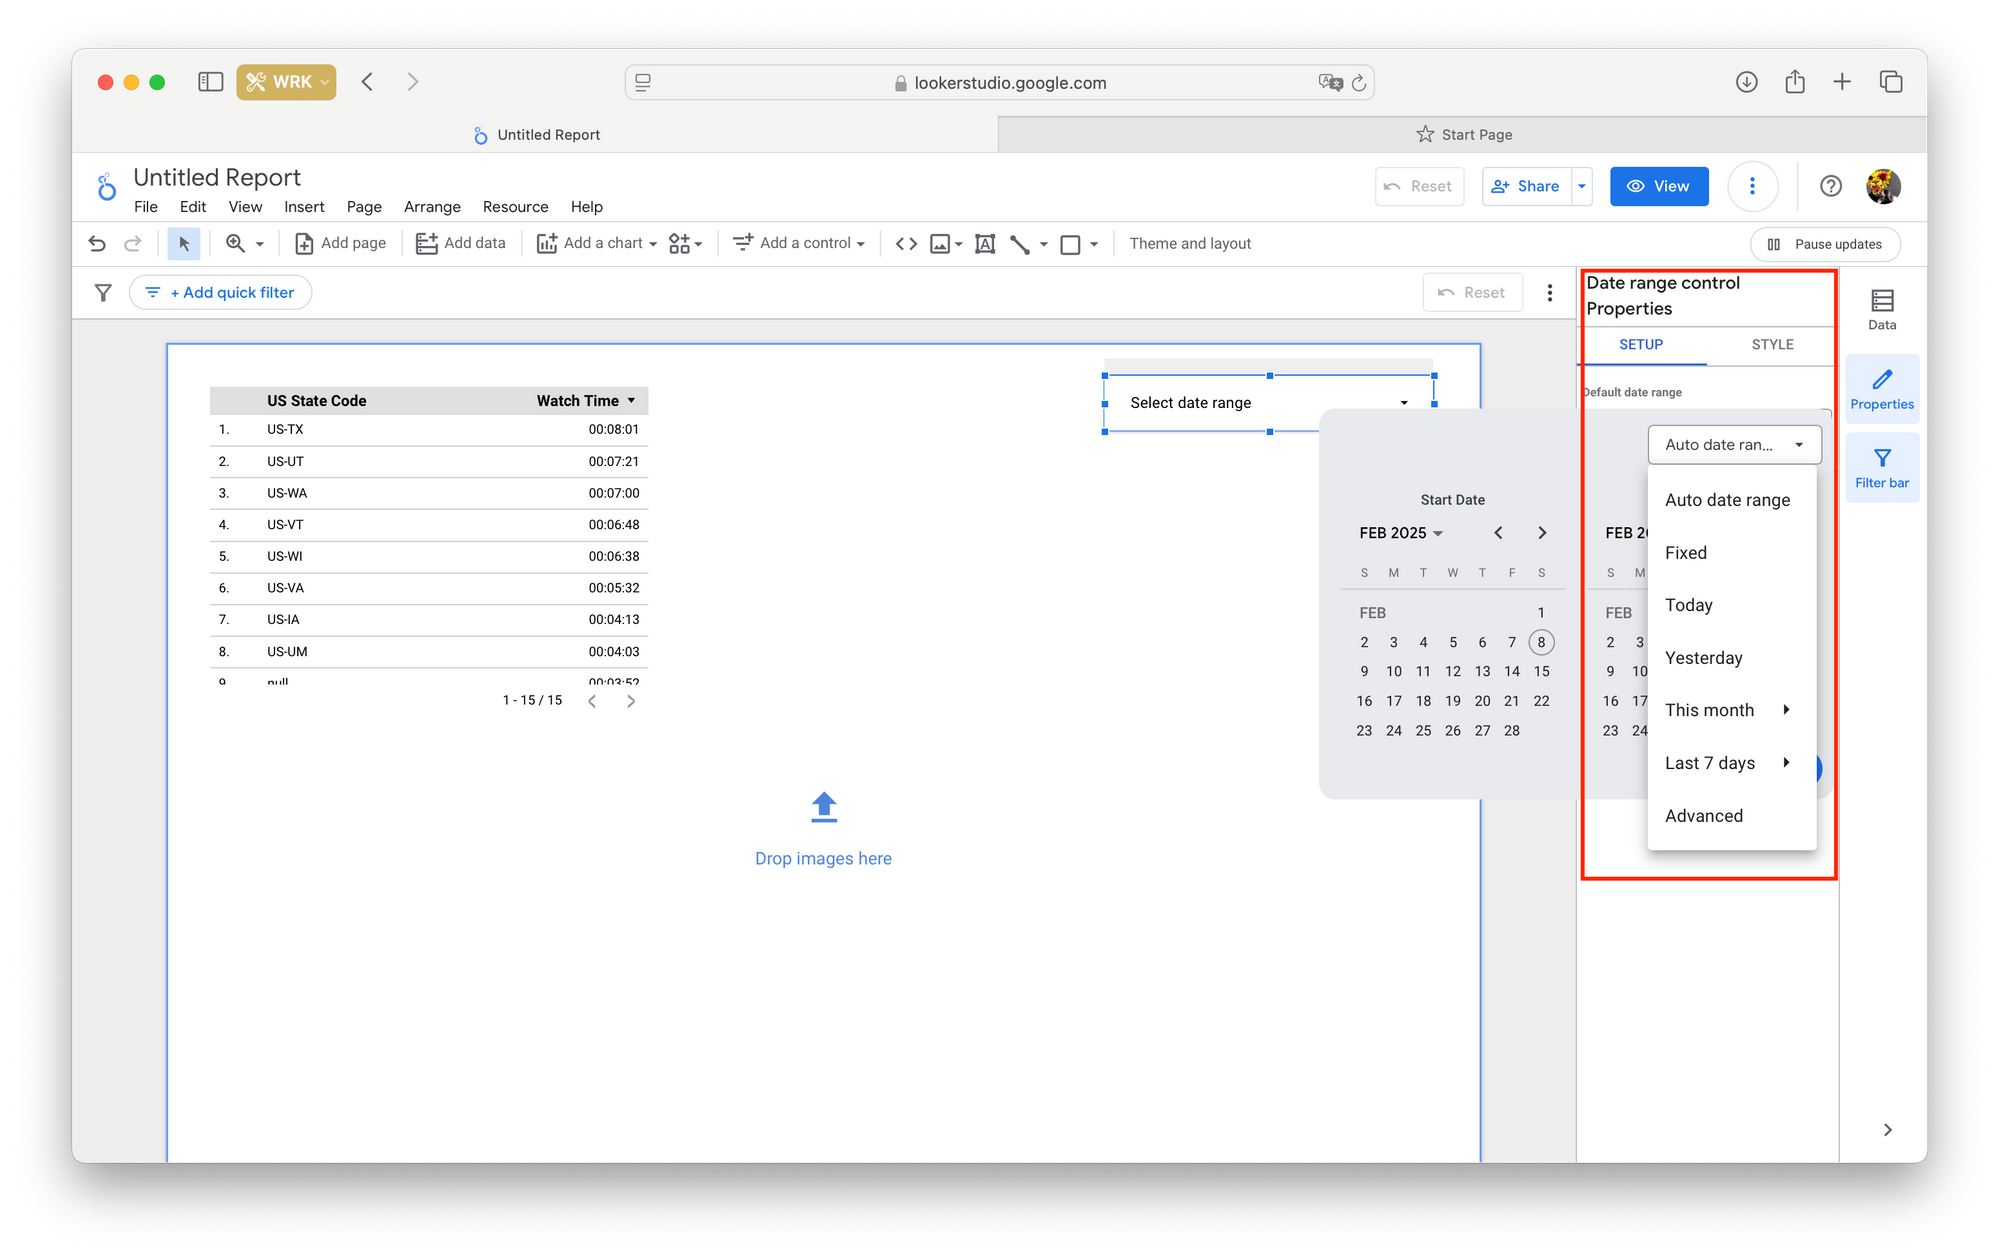
It's possible to configure different data periods for each page. One tab in the report may display data for the current month, another tab may display data for the current quarter, and another tab may display data for the current year. To do this, change the 'default date range' setting in the menu.
Working with charts and tables
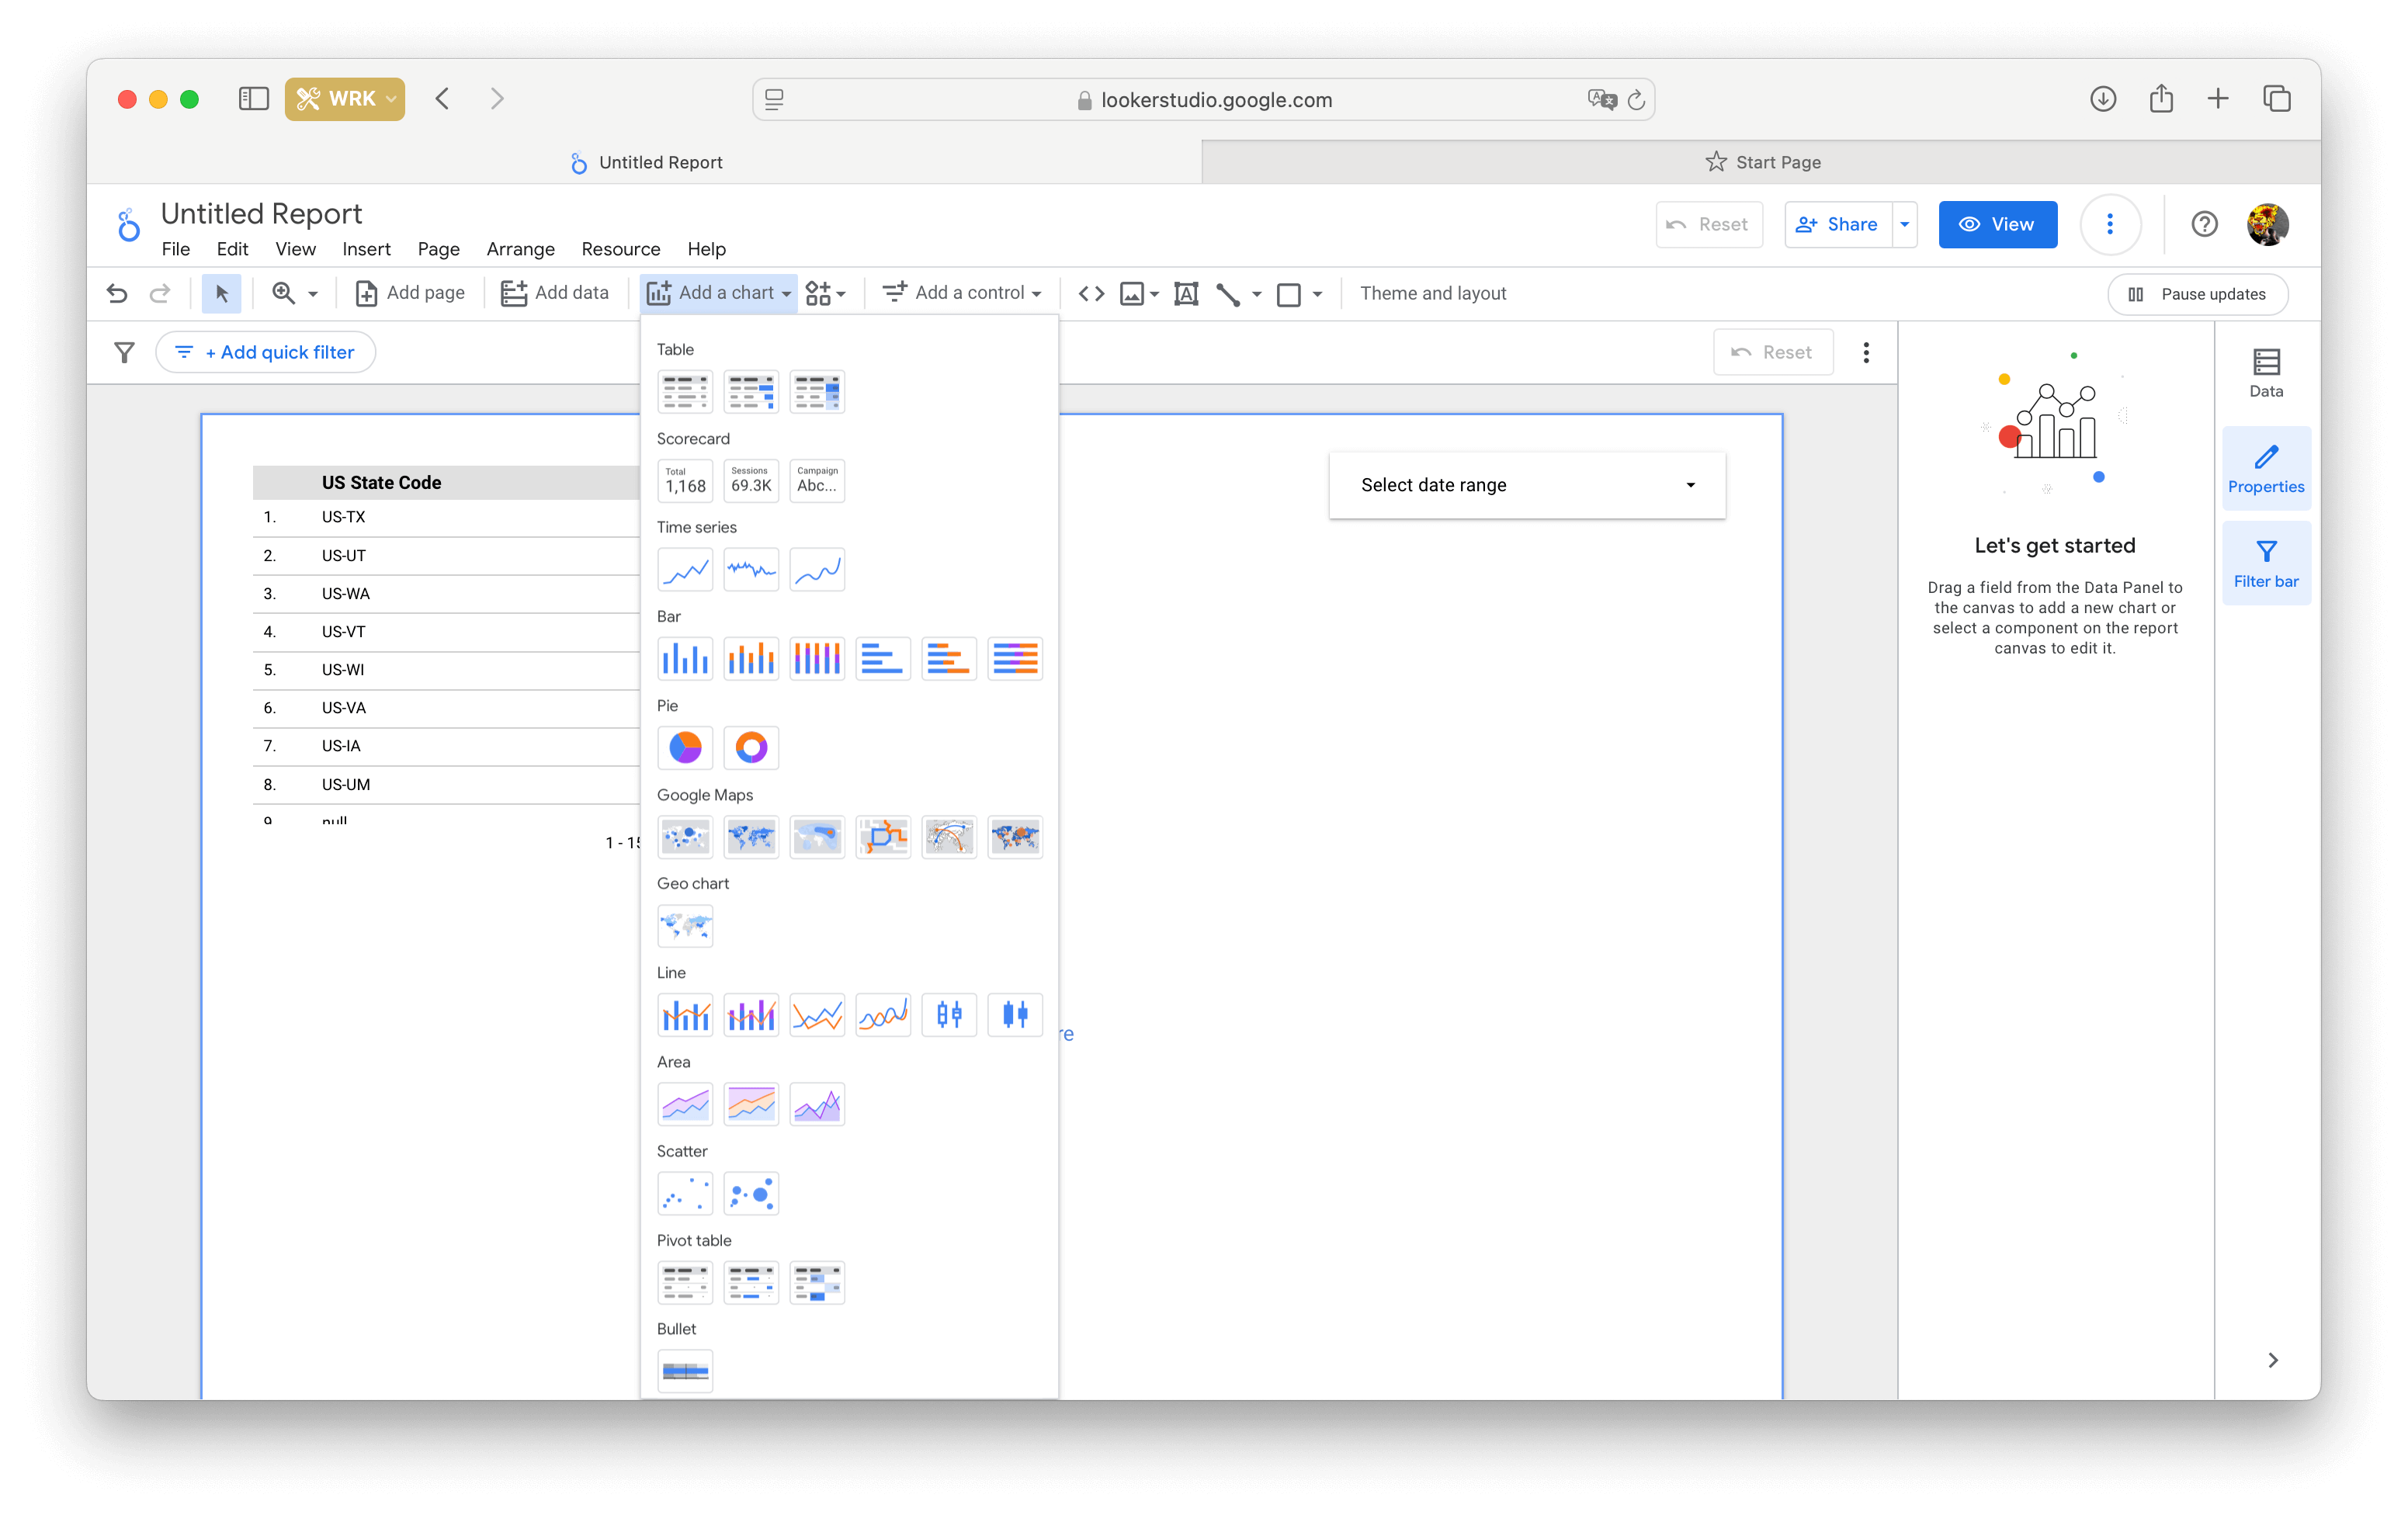
Looker Studio offers a wide variety of visualization elements — from simple tables and line charts to heat maps. You can find them all in the 'Add a chart' menu. To add an element to your report, select it and place it on the page. Elements can be moved, copied, and even transferred between pages. They can be resized by dragging their borders.
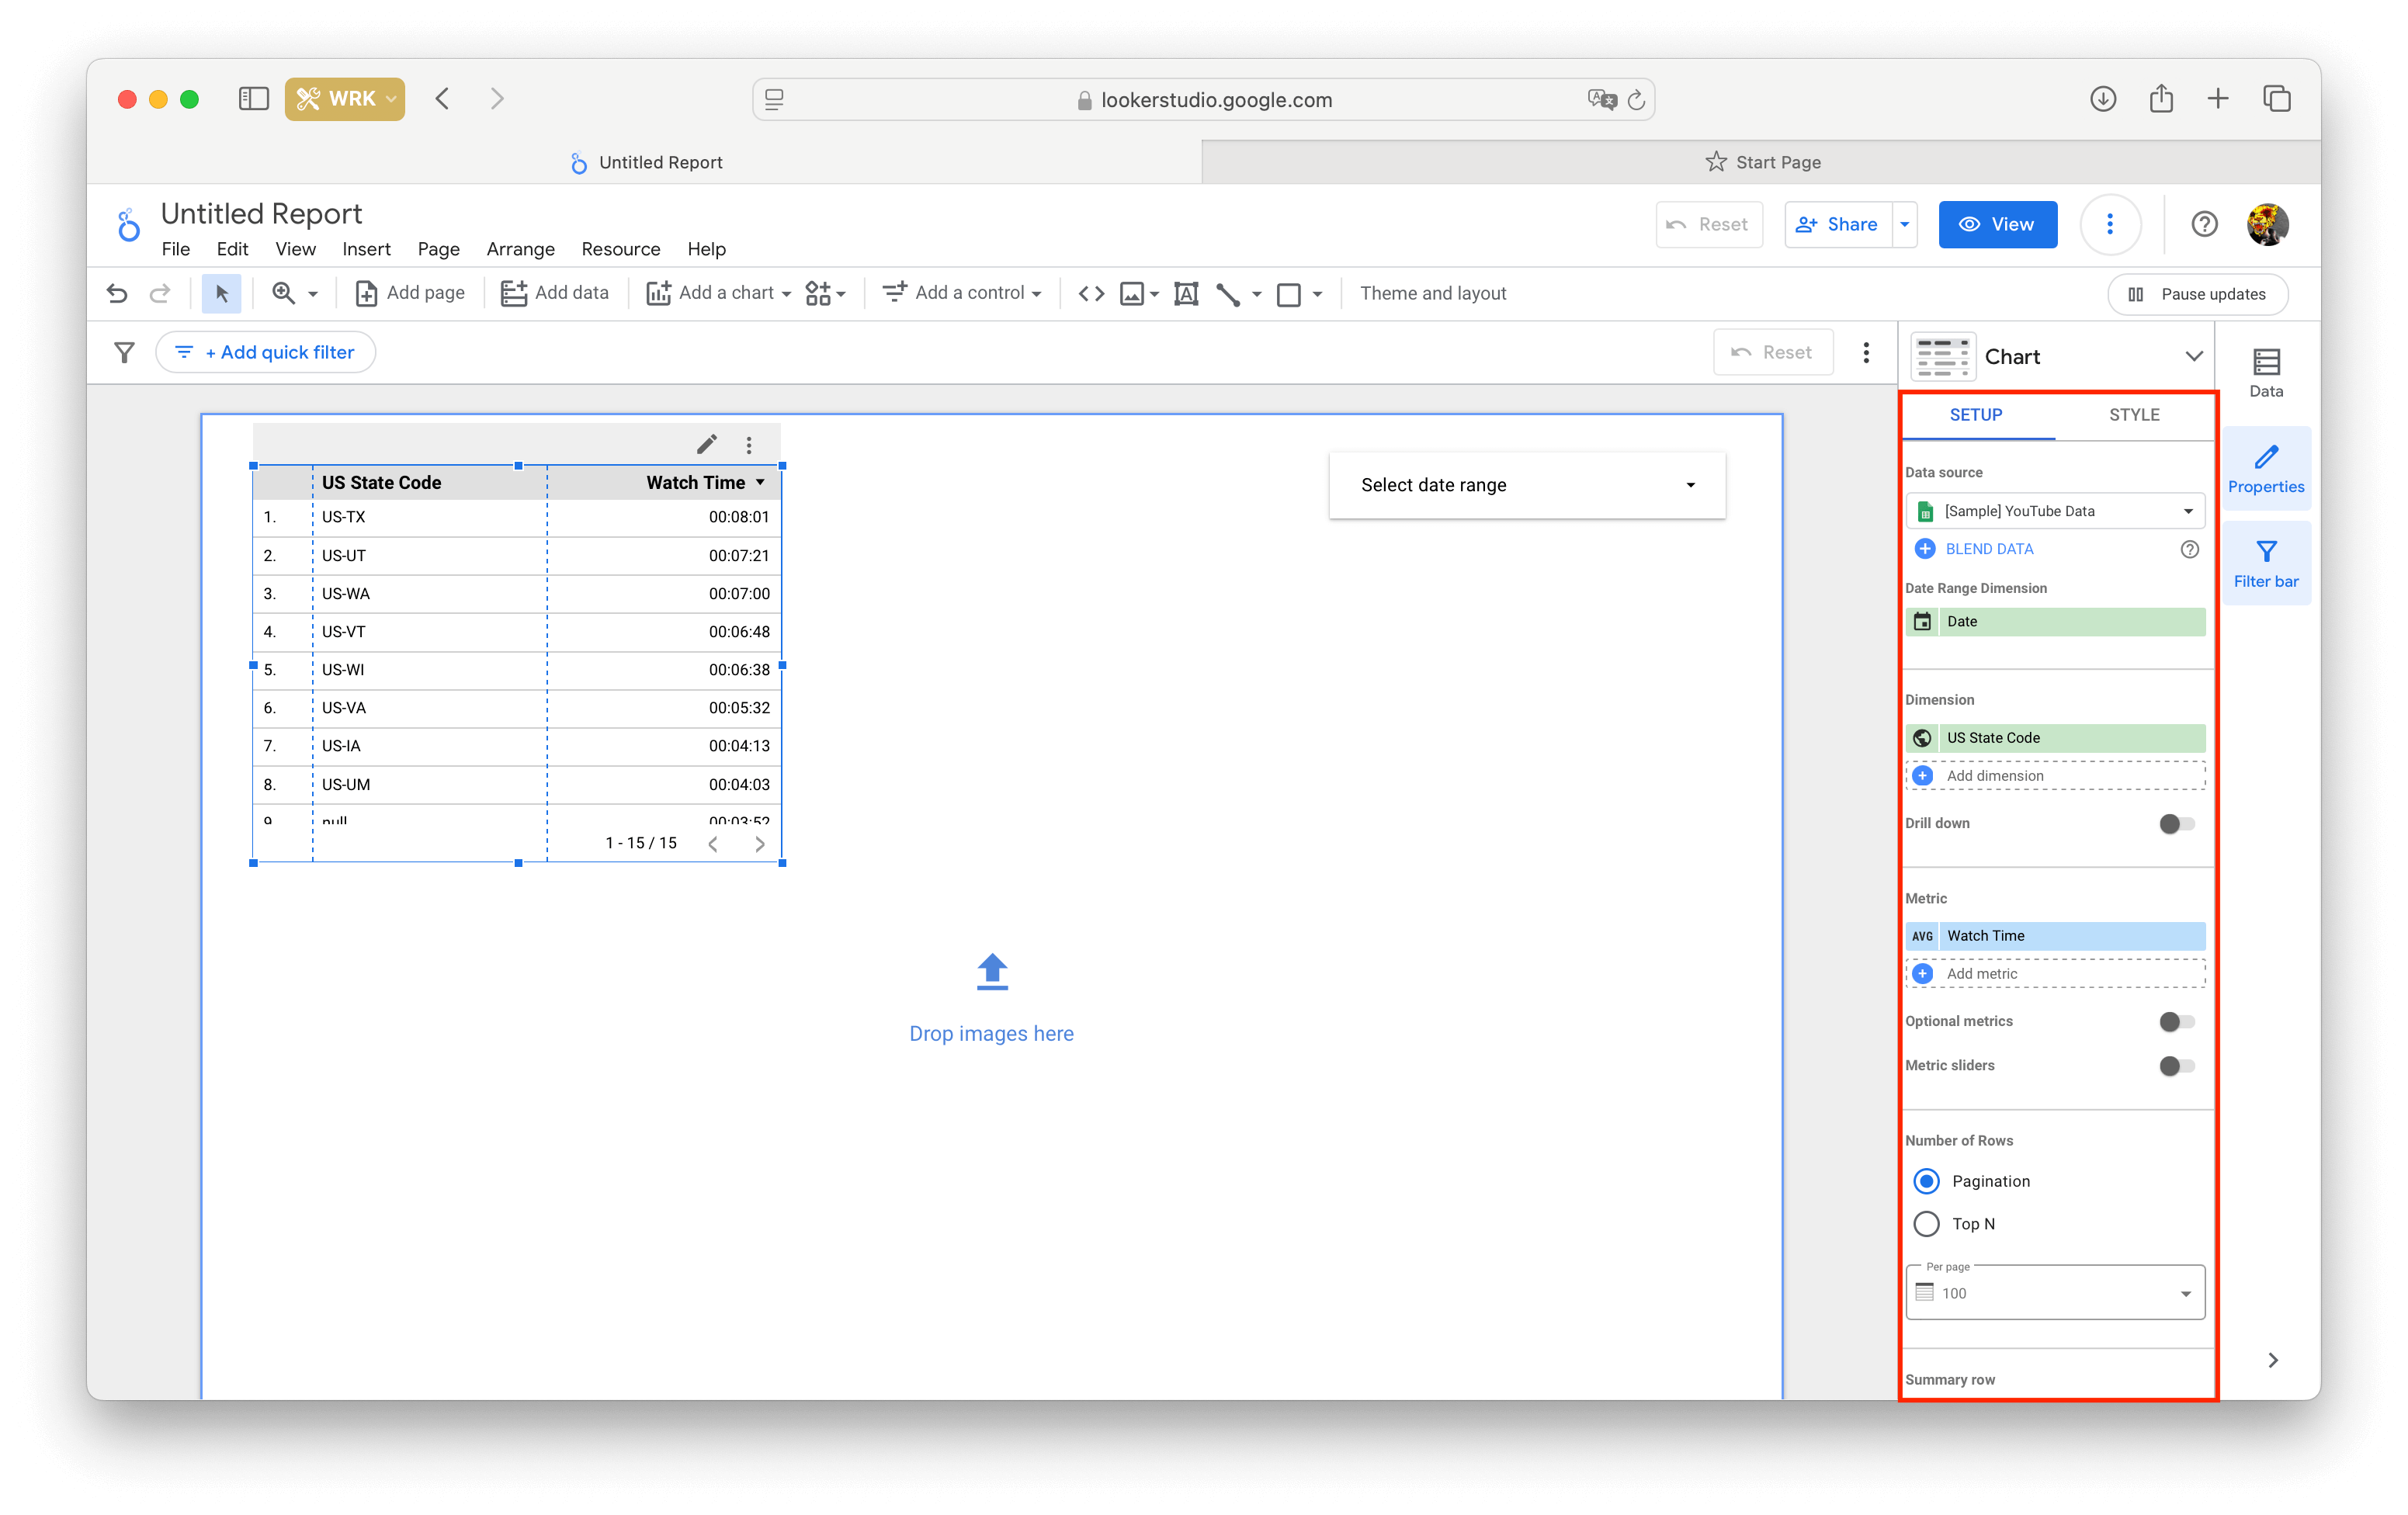
After adding an item, a pane will open to the right. There you'll have to choose at least four settings:
- Data source – what information the element will display (e.g., Google Ads data).
- Dimension – how the data will be divided (e.g. campaign name).
- Metric – what values to display (e.g. average CPC).
- Sort order – how to sort the information (e.g. by ascending CPC or descending CTR).
For line charts, you'll need to choose a time unit that suits your needs as a dimension. Data can be divided into hours, days, weeks, months, quarters or years.
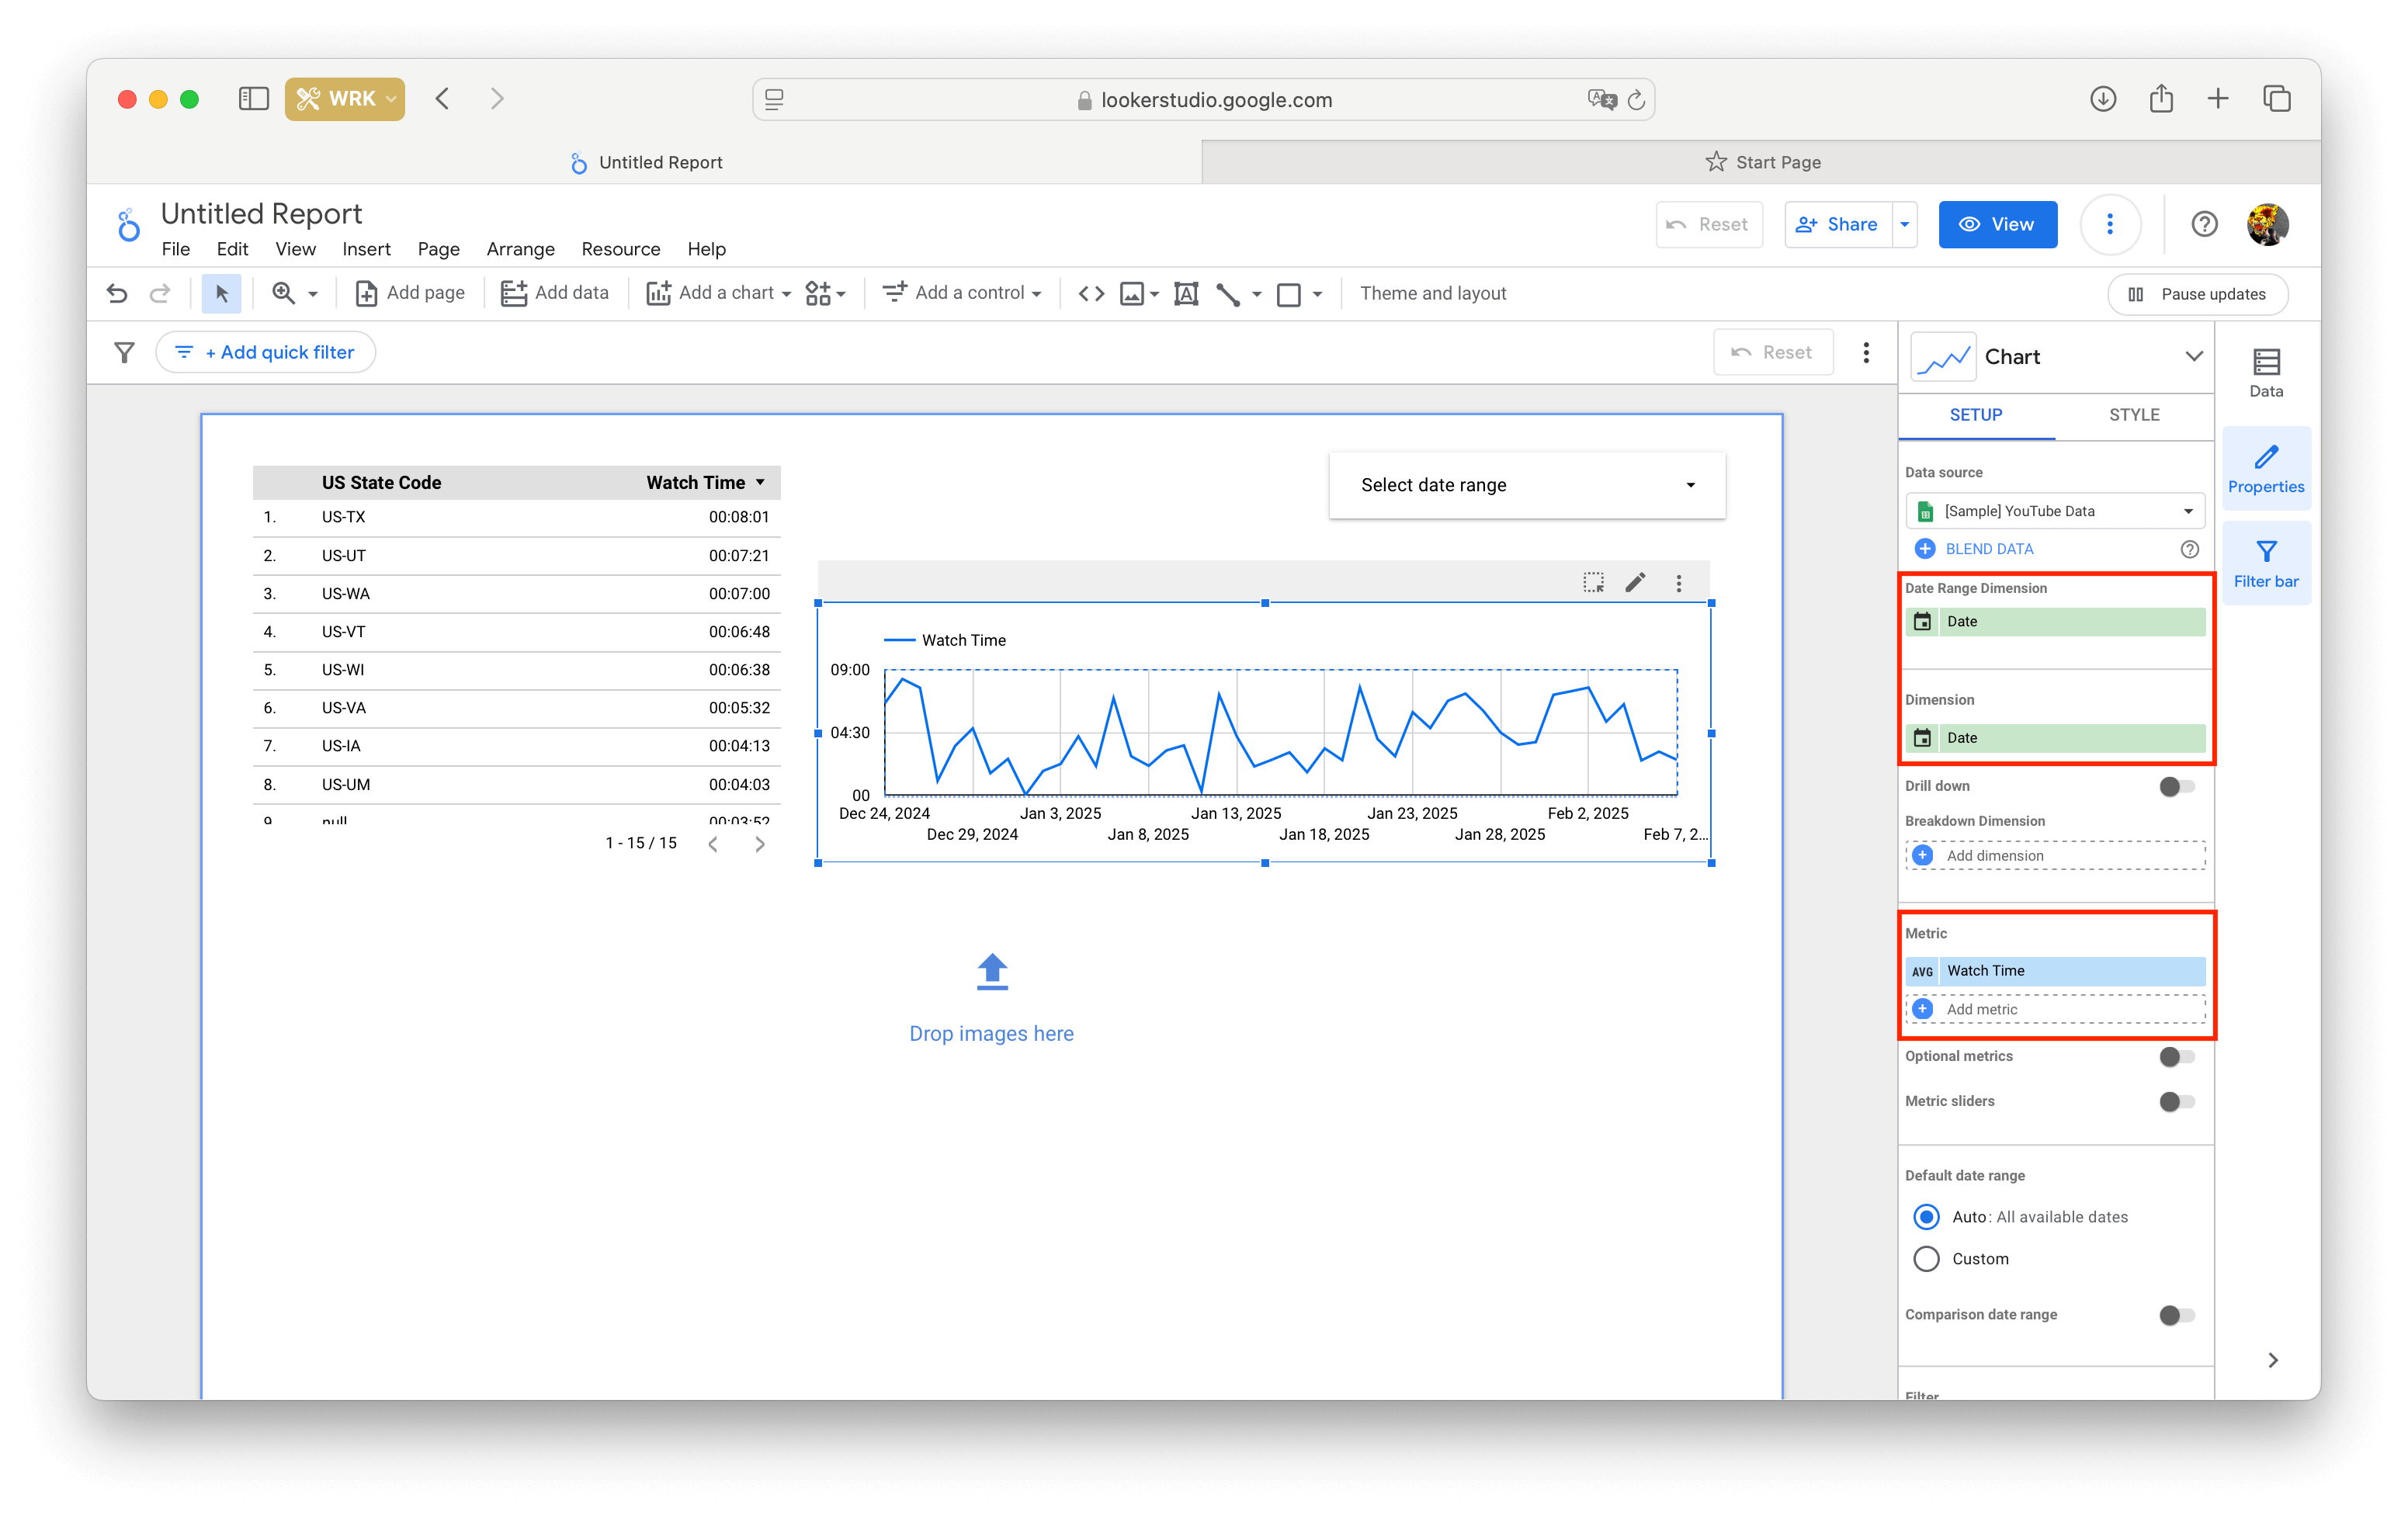
If two metrics with heavily different values are placed on one chart, it's recommended to add additional axis. You'll find it in the Style tab, where you'll also be able to create trend lines, add data labels and invert the chart.
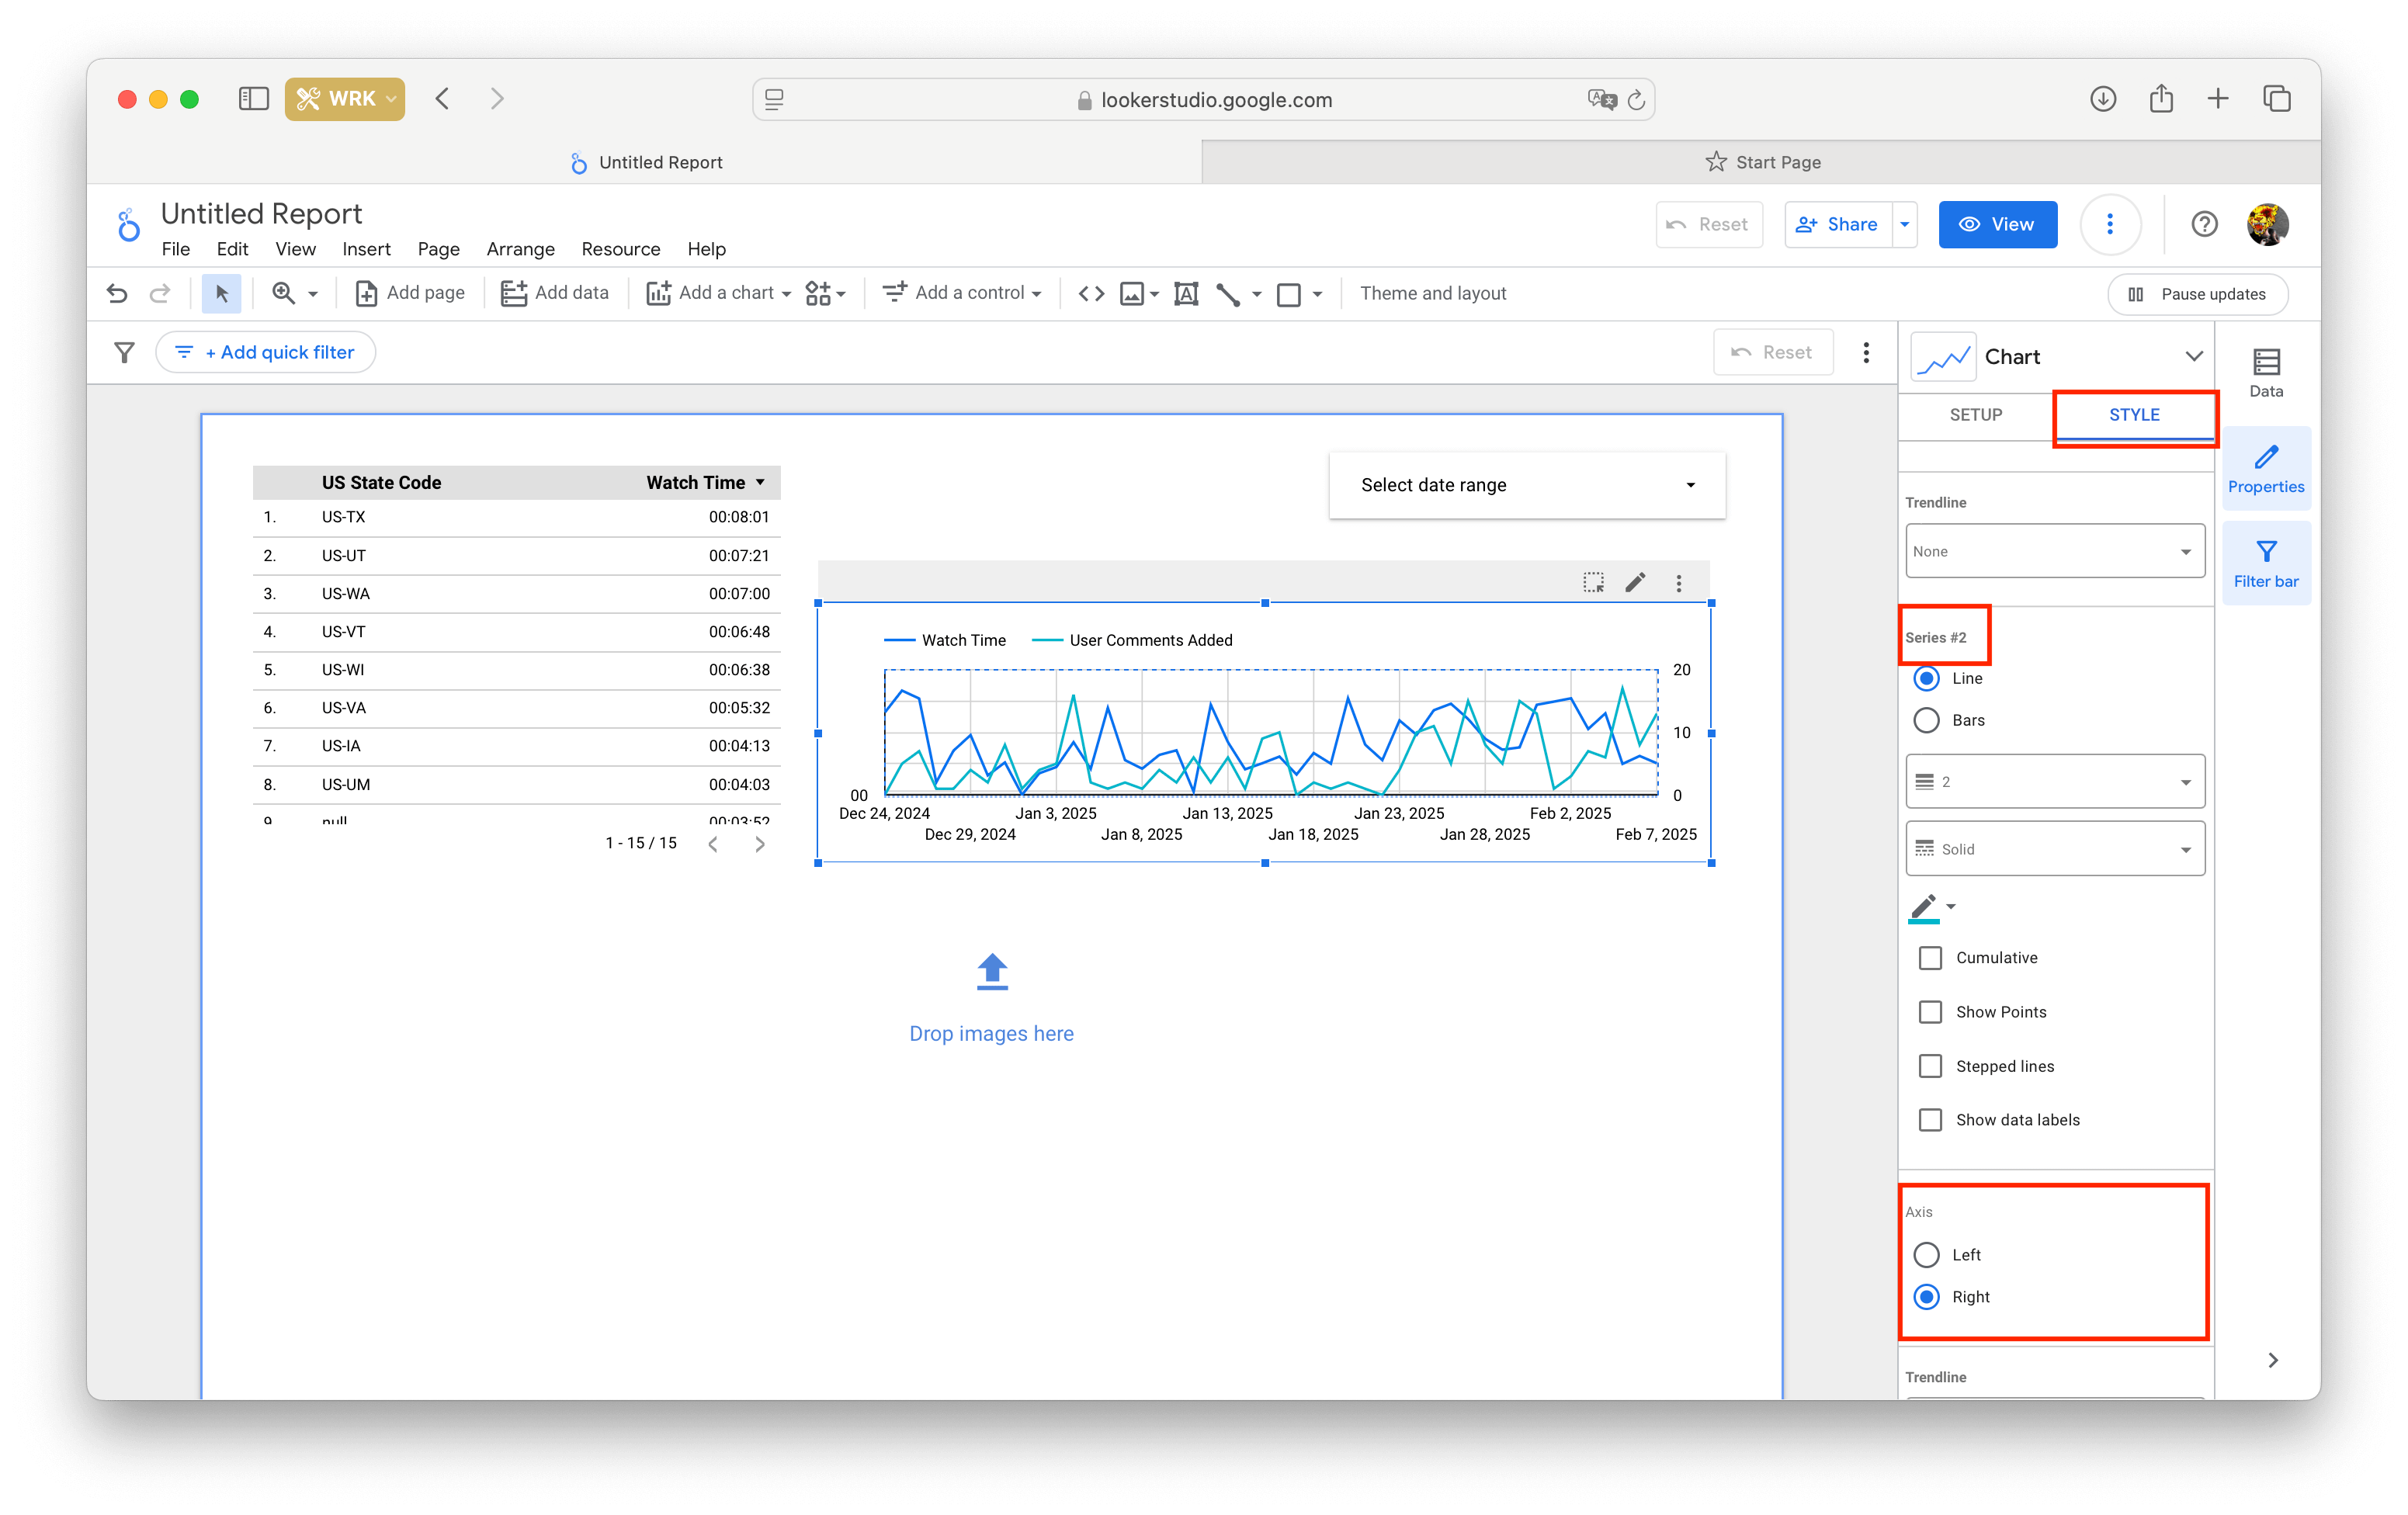
A report can have multiple data sources connected at once, so you can combine metrics and check a set of KPIs simultaneously.
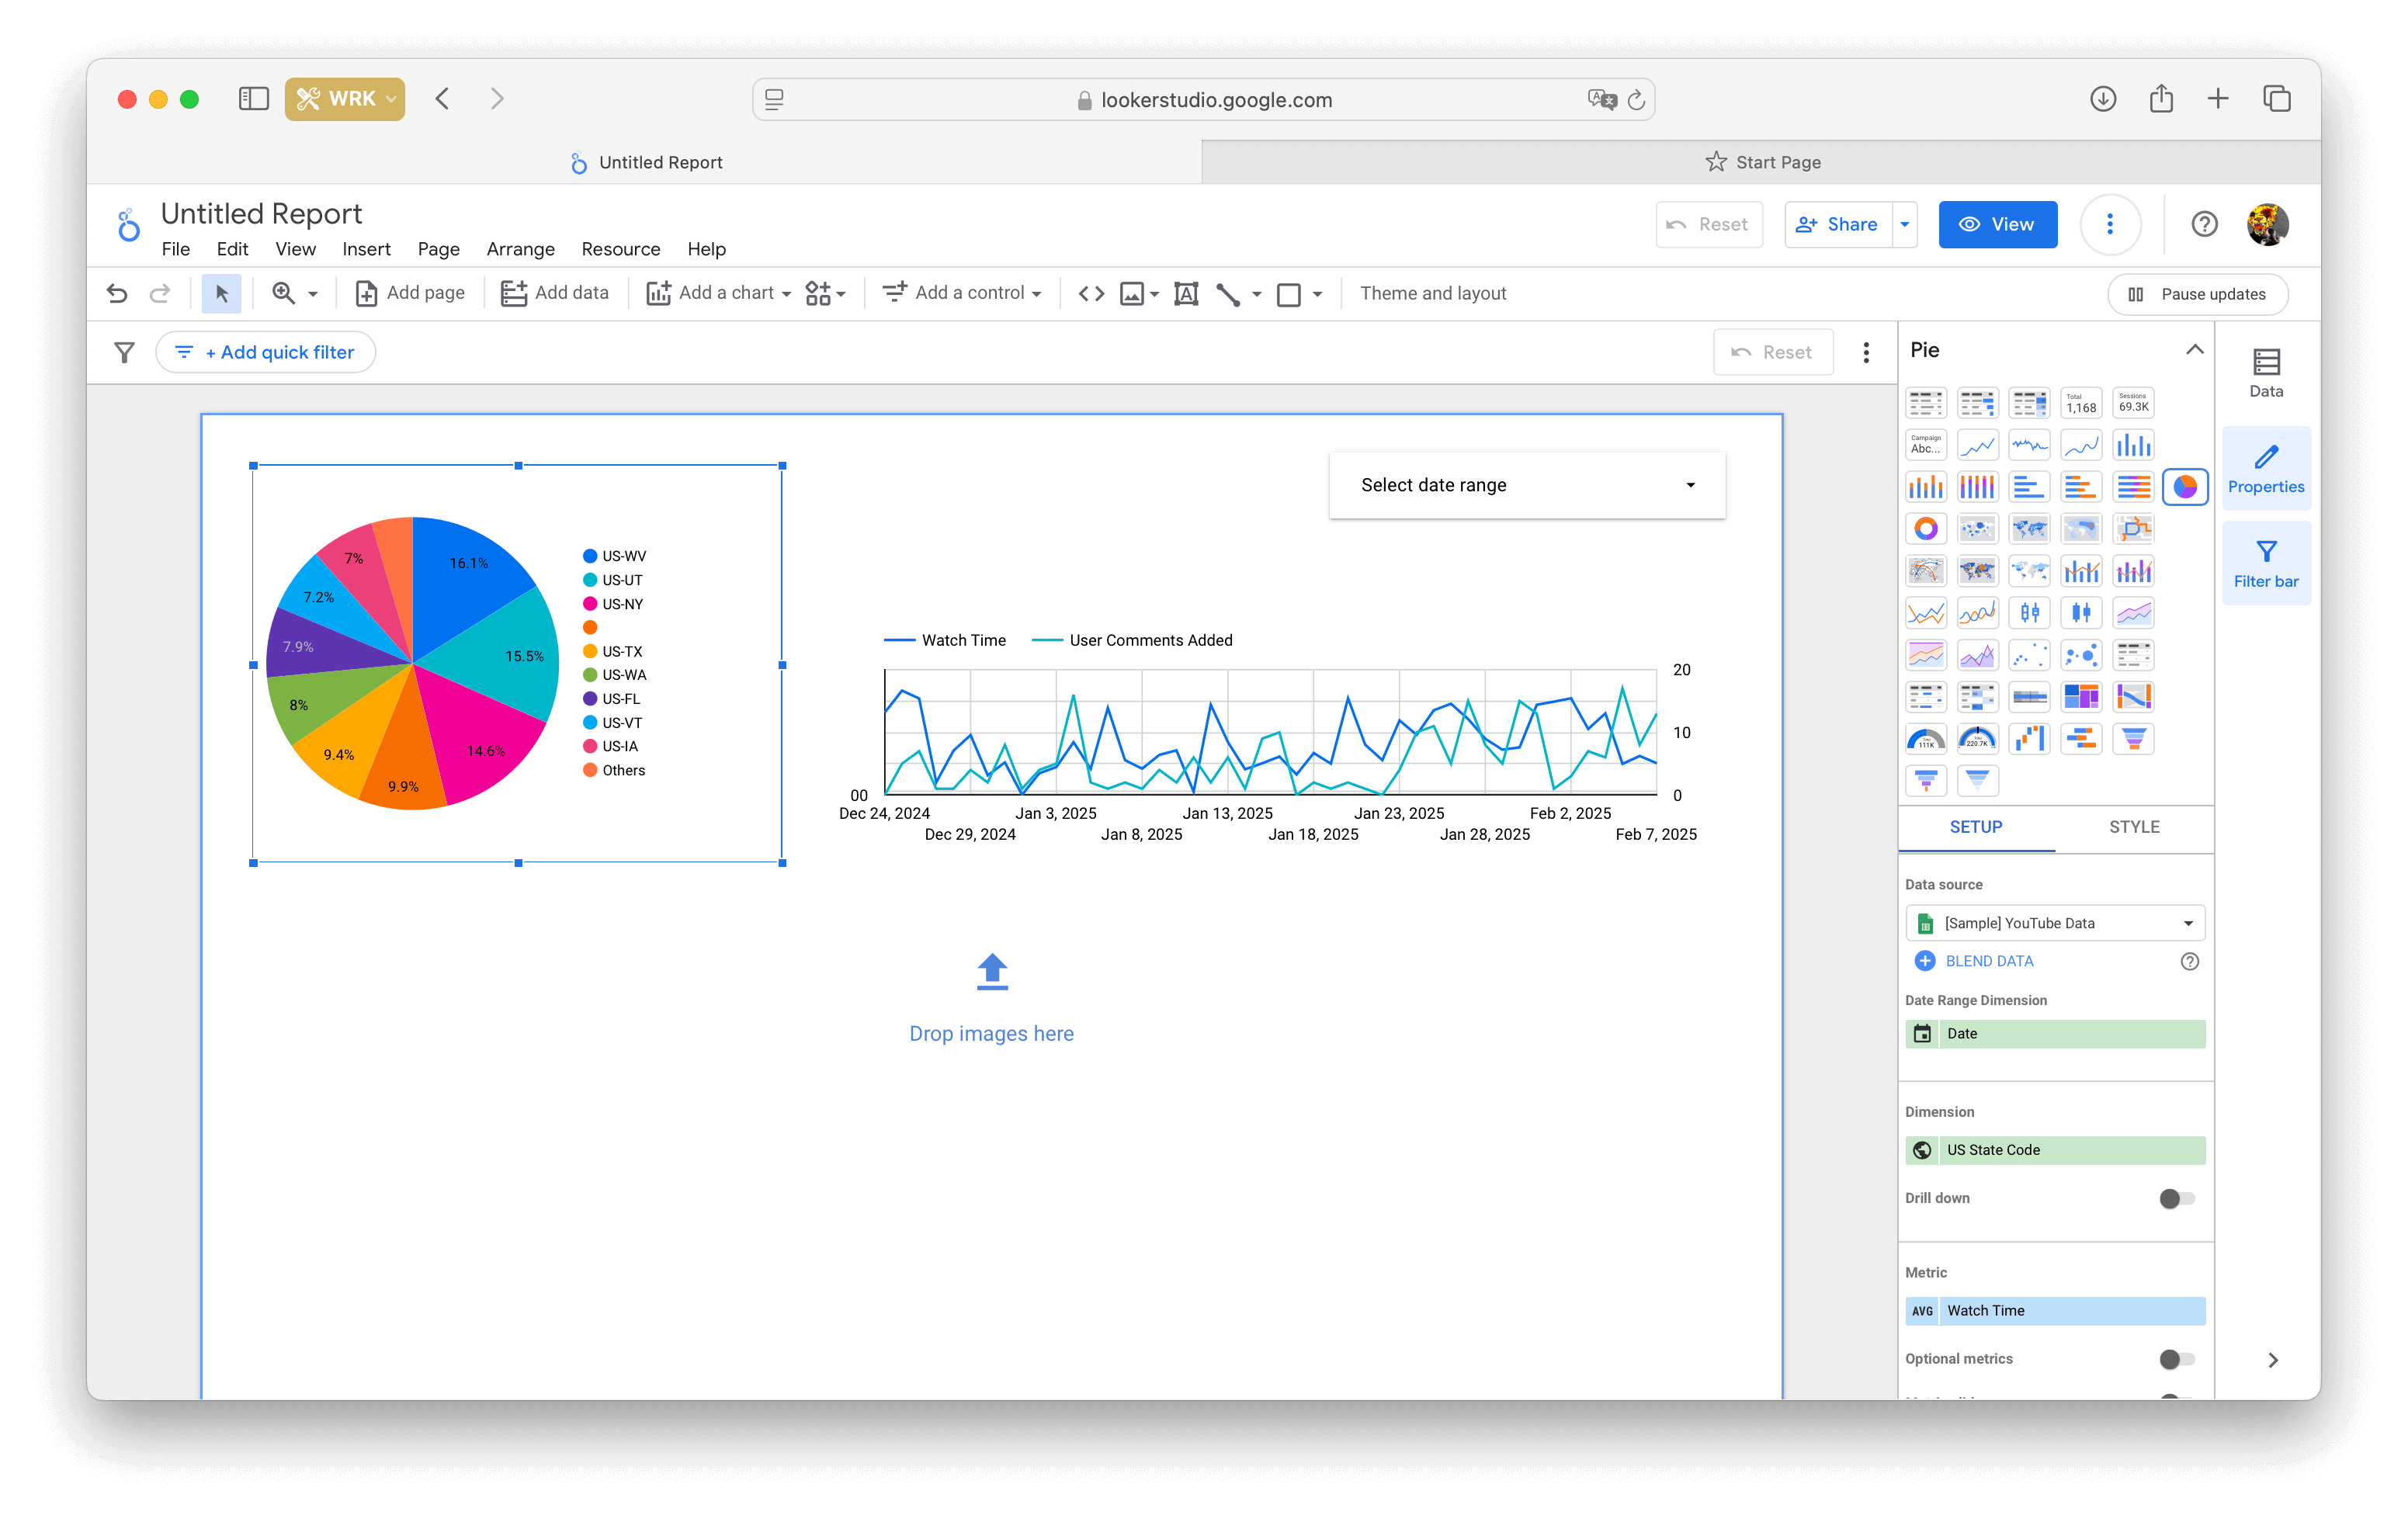
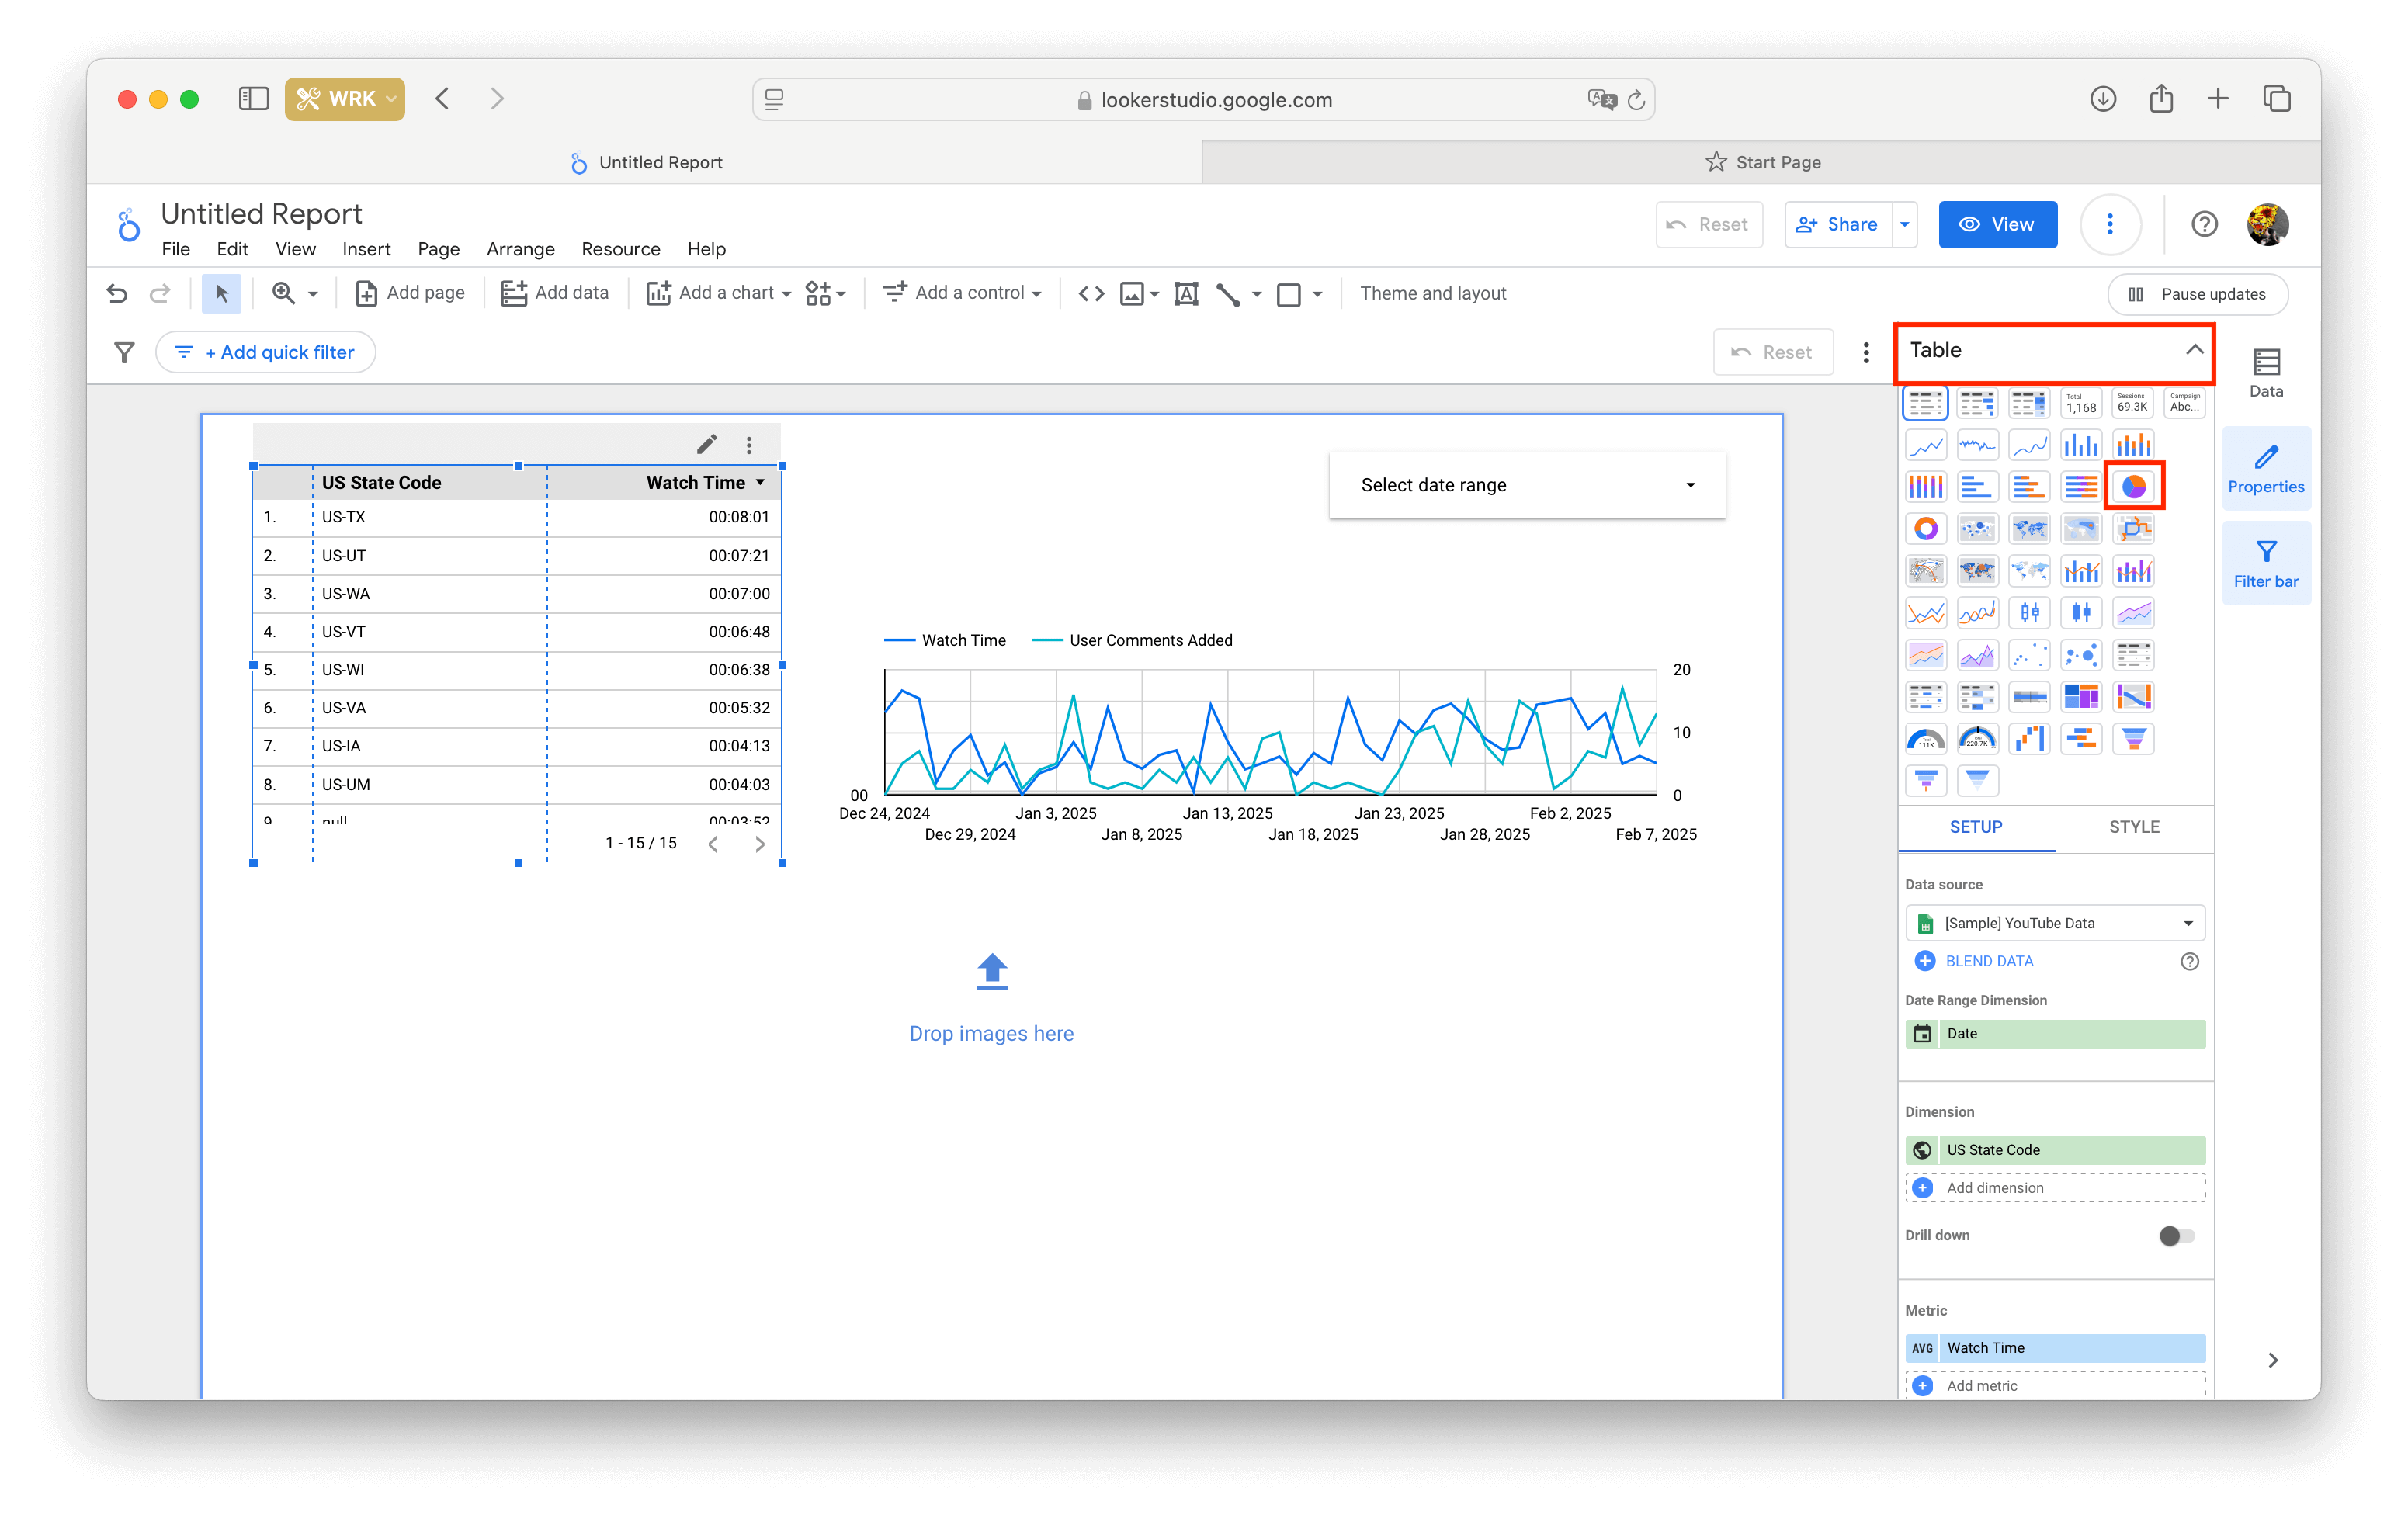
Changing the element type
To convert an existing line chart to a table or pie chart, click the chart name on the right.
Creating custom fields
You don't have to use only the standard dimensions and metrics from the data source — you can create your own. It's done using the 'Add Calculated Field' option in the drop-down menu.
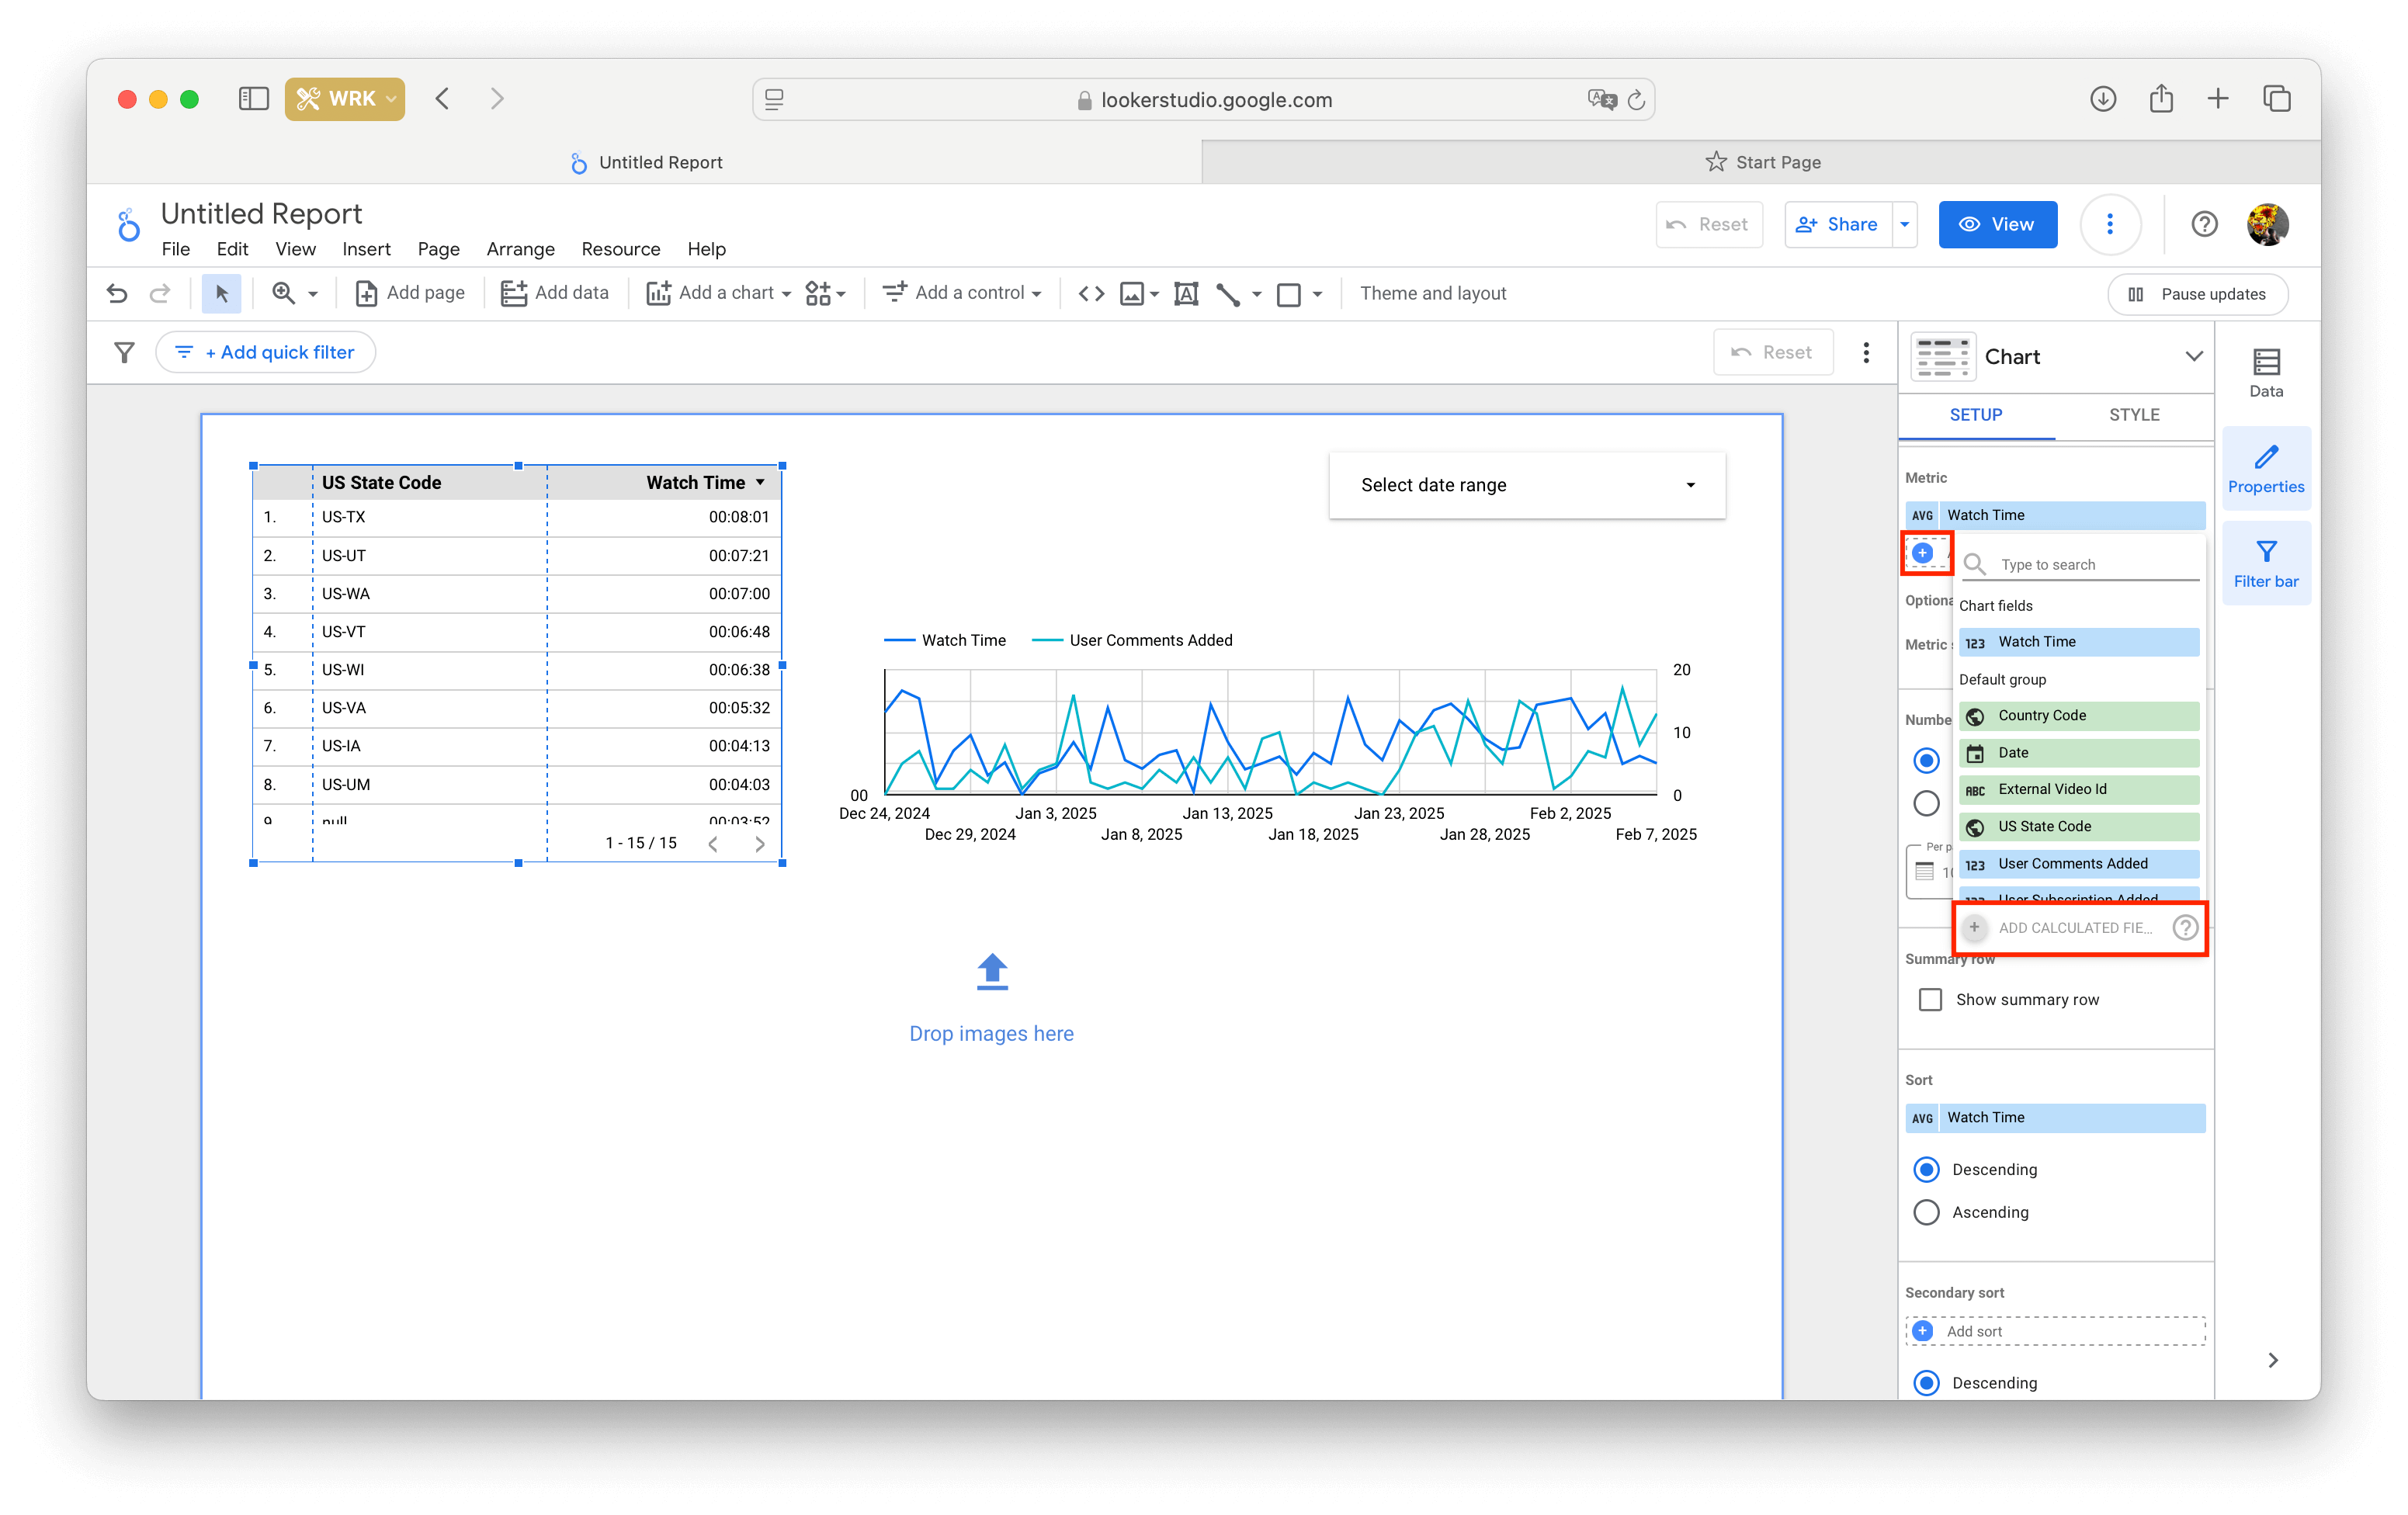
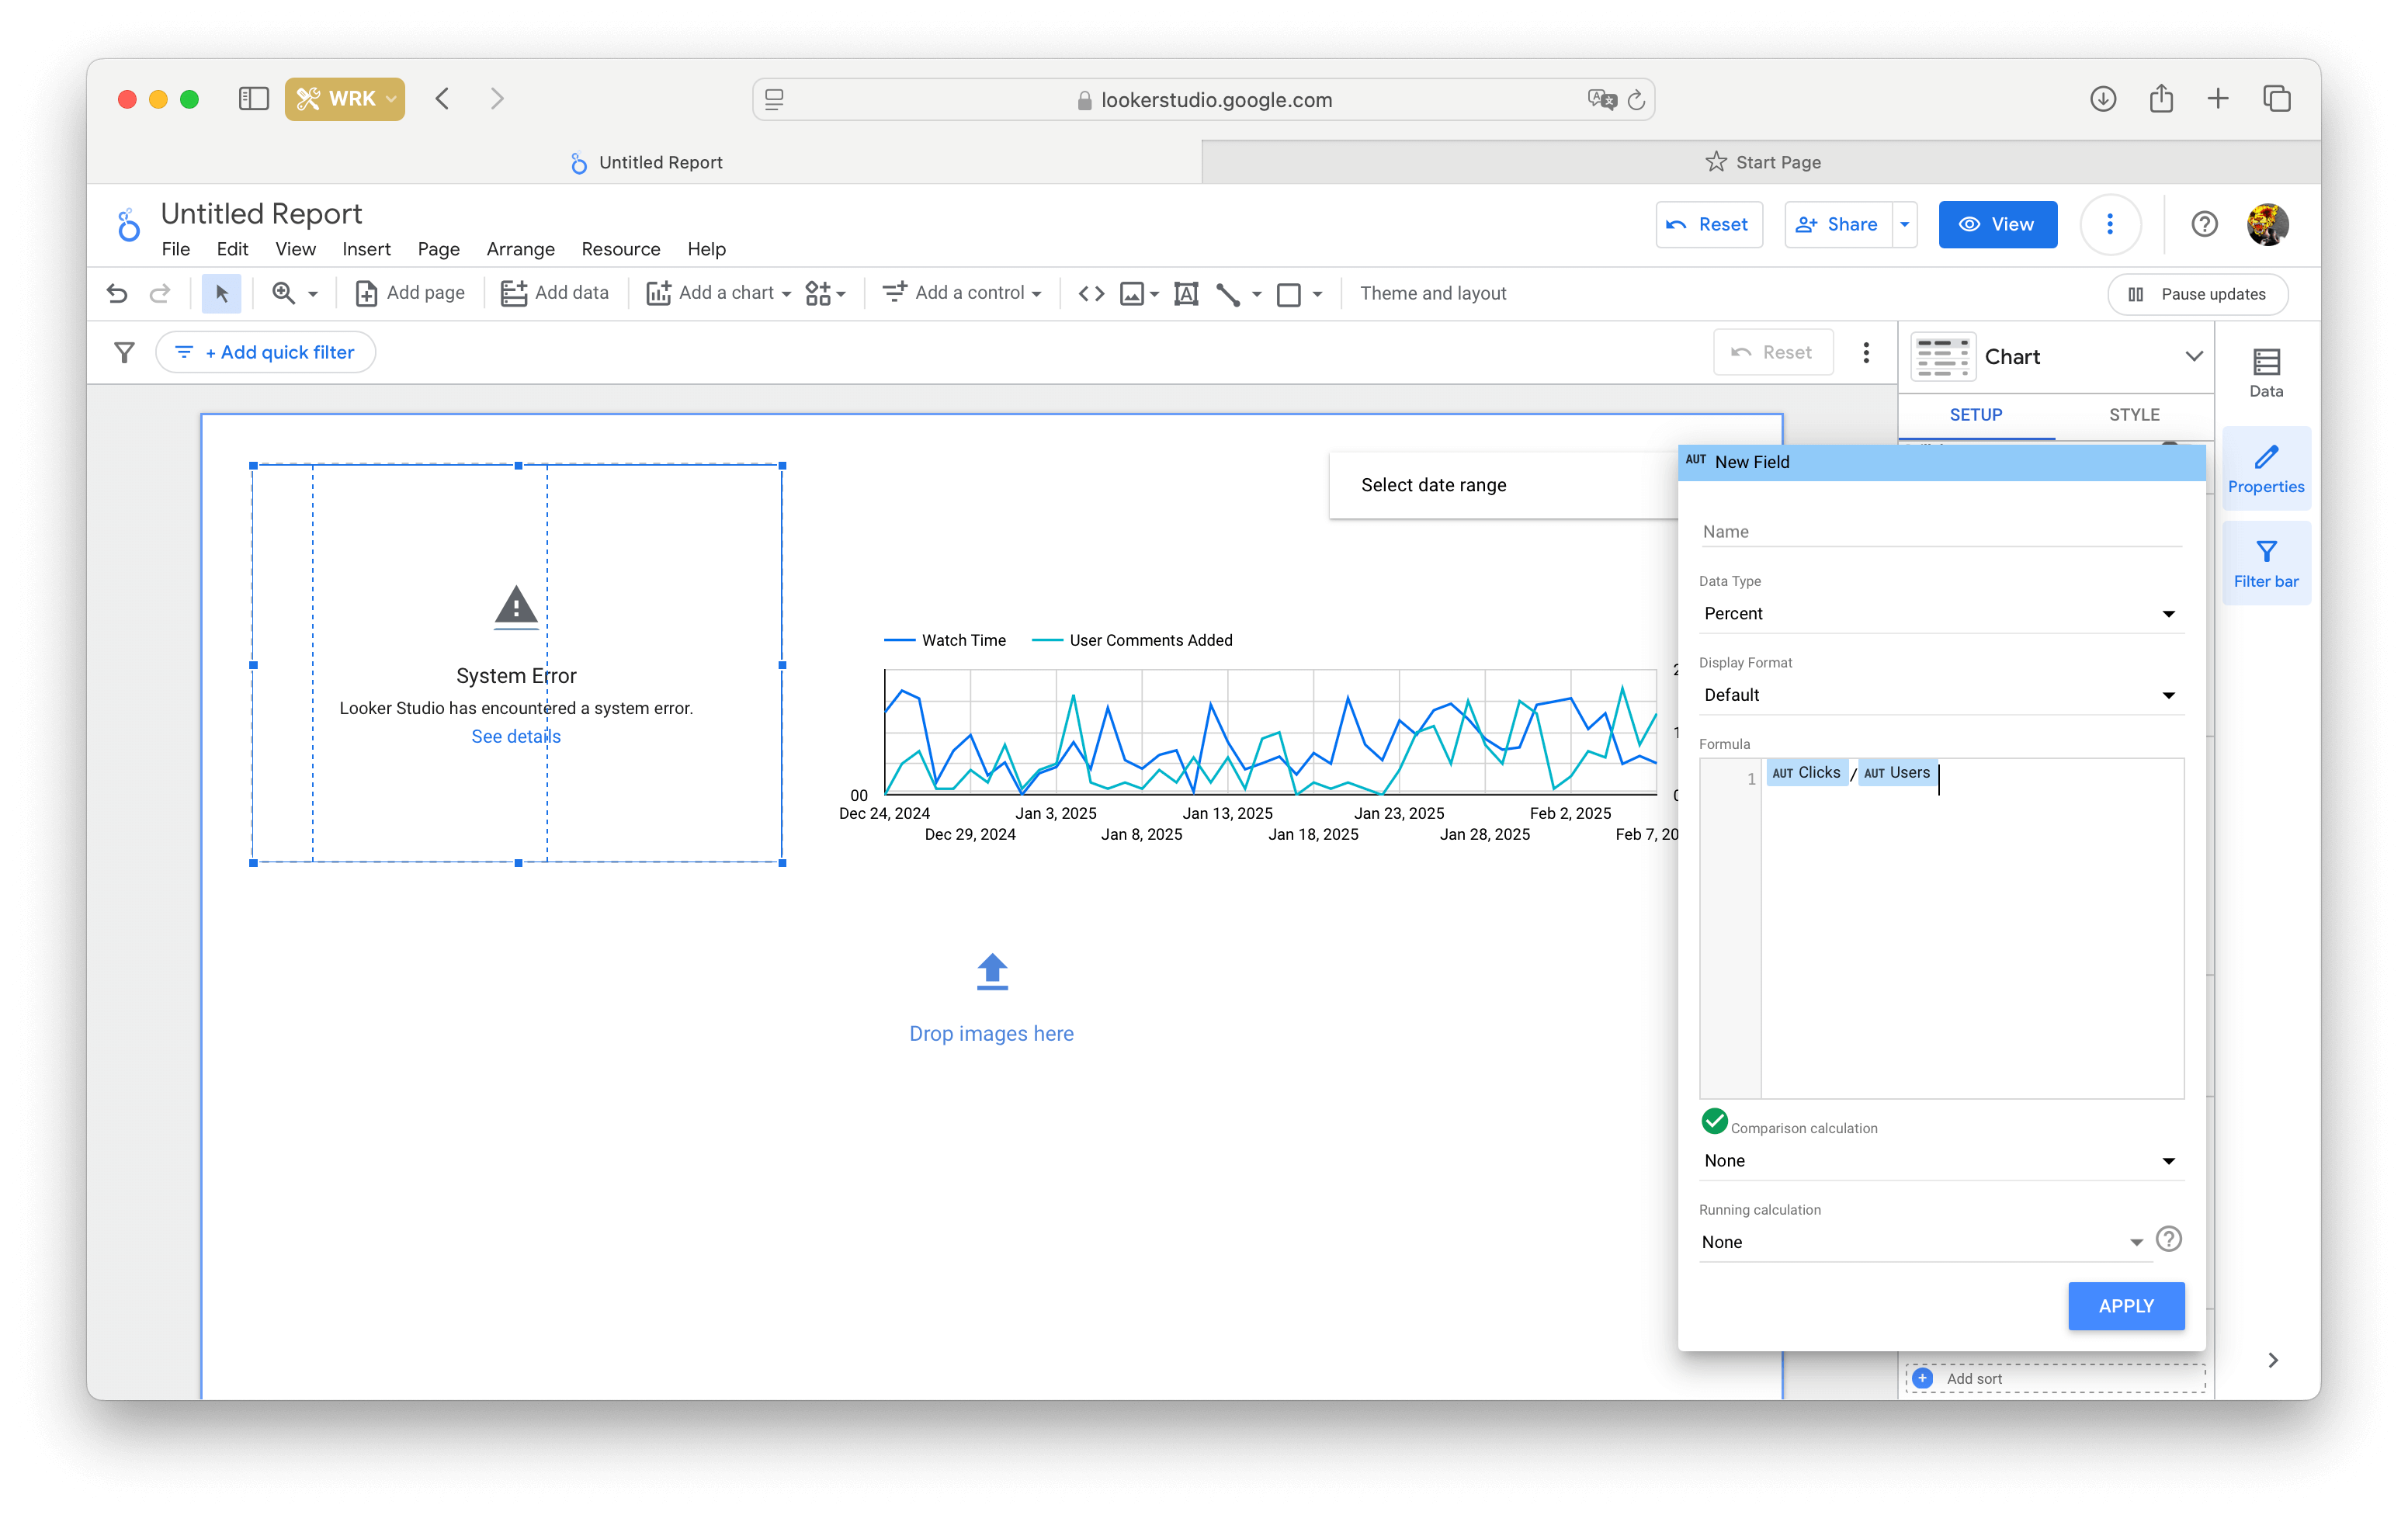
Enter formulas to calculate your metric, give it a name, and specify its format. For example, you can use a custom field to track the average number of clicks per user. To do this, simply create a formula like 'Clicks/Users'. As you type in the formula, Looker Studio will fill in the available metrics from the data source automatically.
Looker Studio formulas support:
- arithmetic operations
- logical operators
- text functions
- date functions
- geographic unit functions
To better understand the syntax specifics, take a tutorial in the Google Looker Studio Docs Center and study the full list of available functions.
Working with images, figures, and text
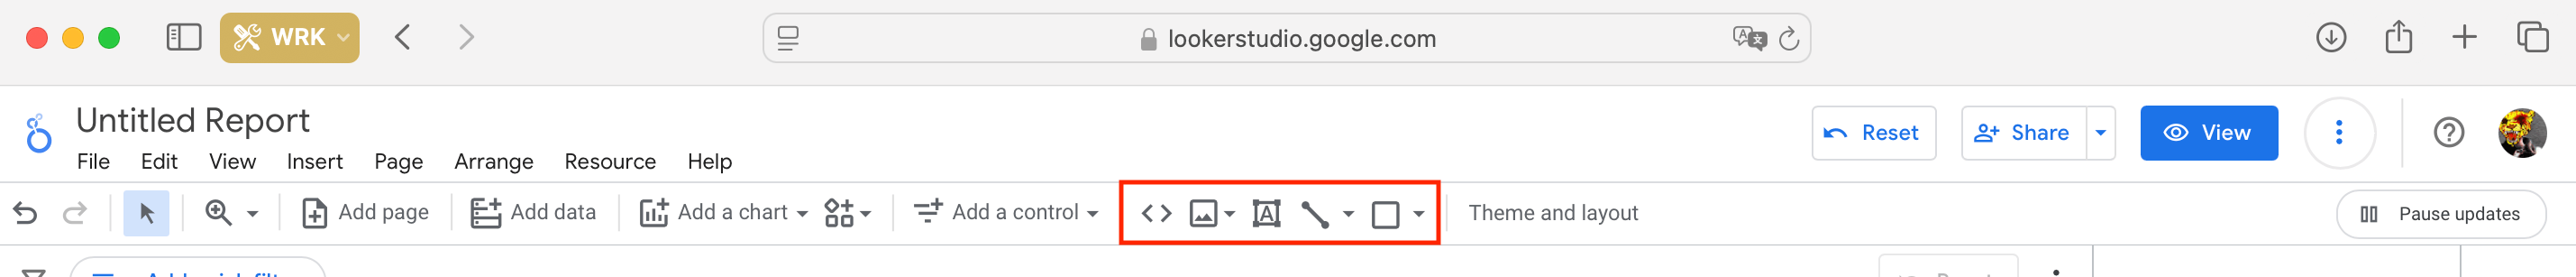
A report is more user-friendly and visually appealing when you use add a bit of design. All visual elements are located in the toolbar:
- Embedded elements
- Images
- Text
- Lines and arrows
- Rectangles and circles
Embedded elements
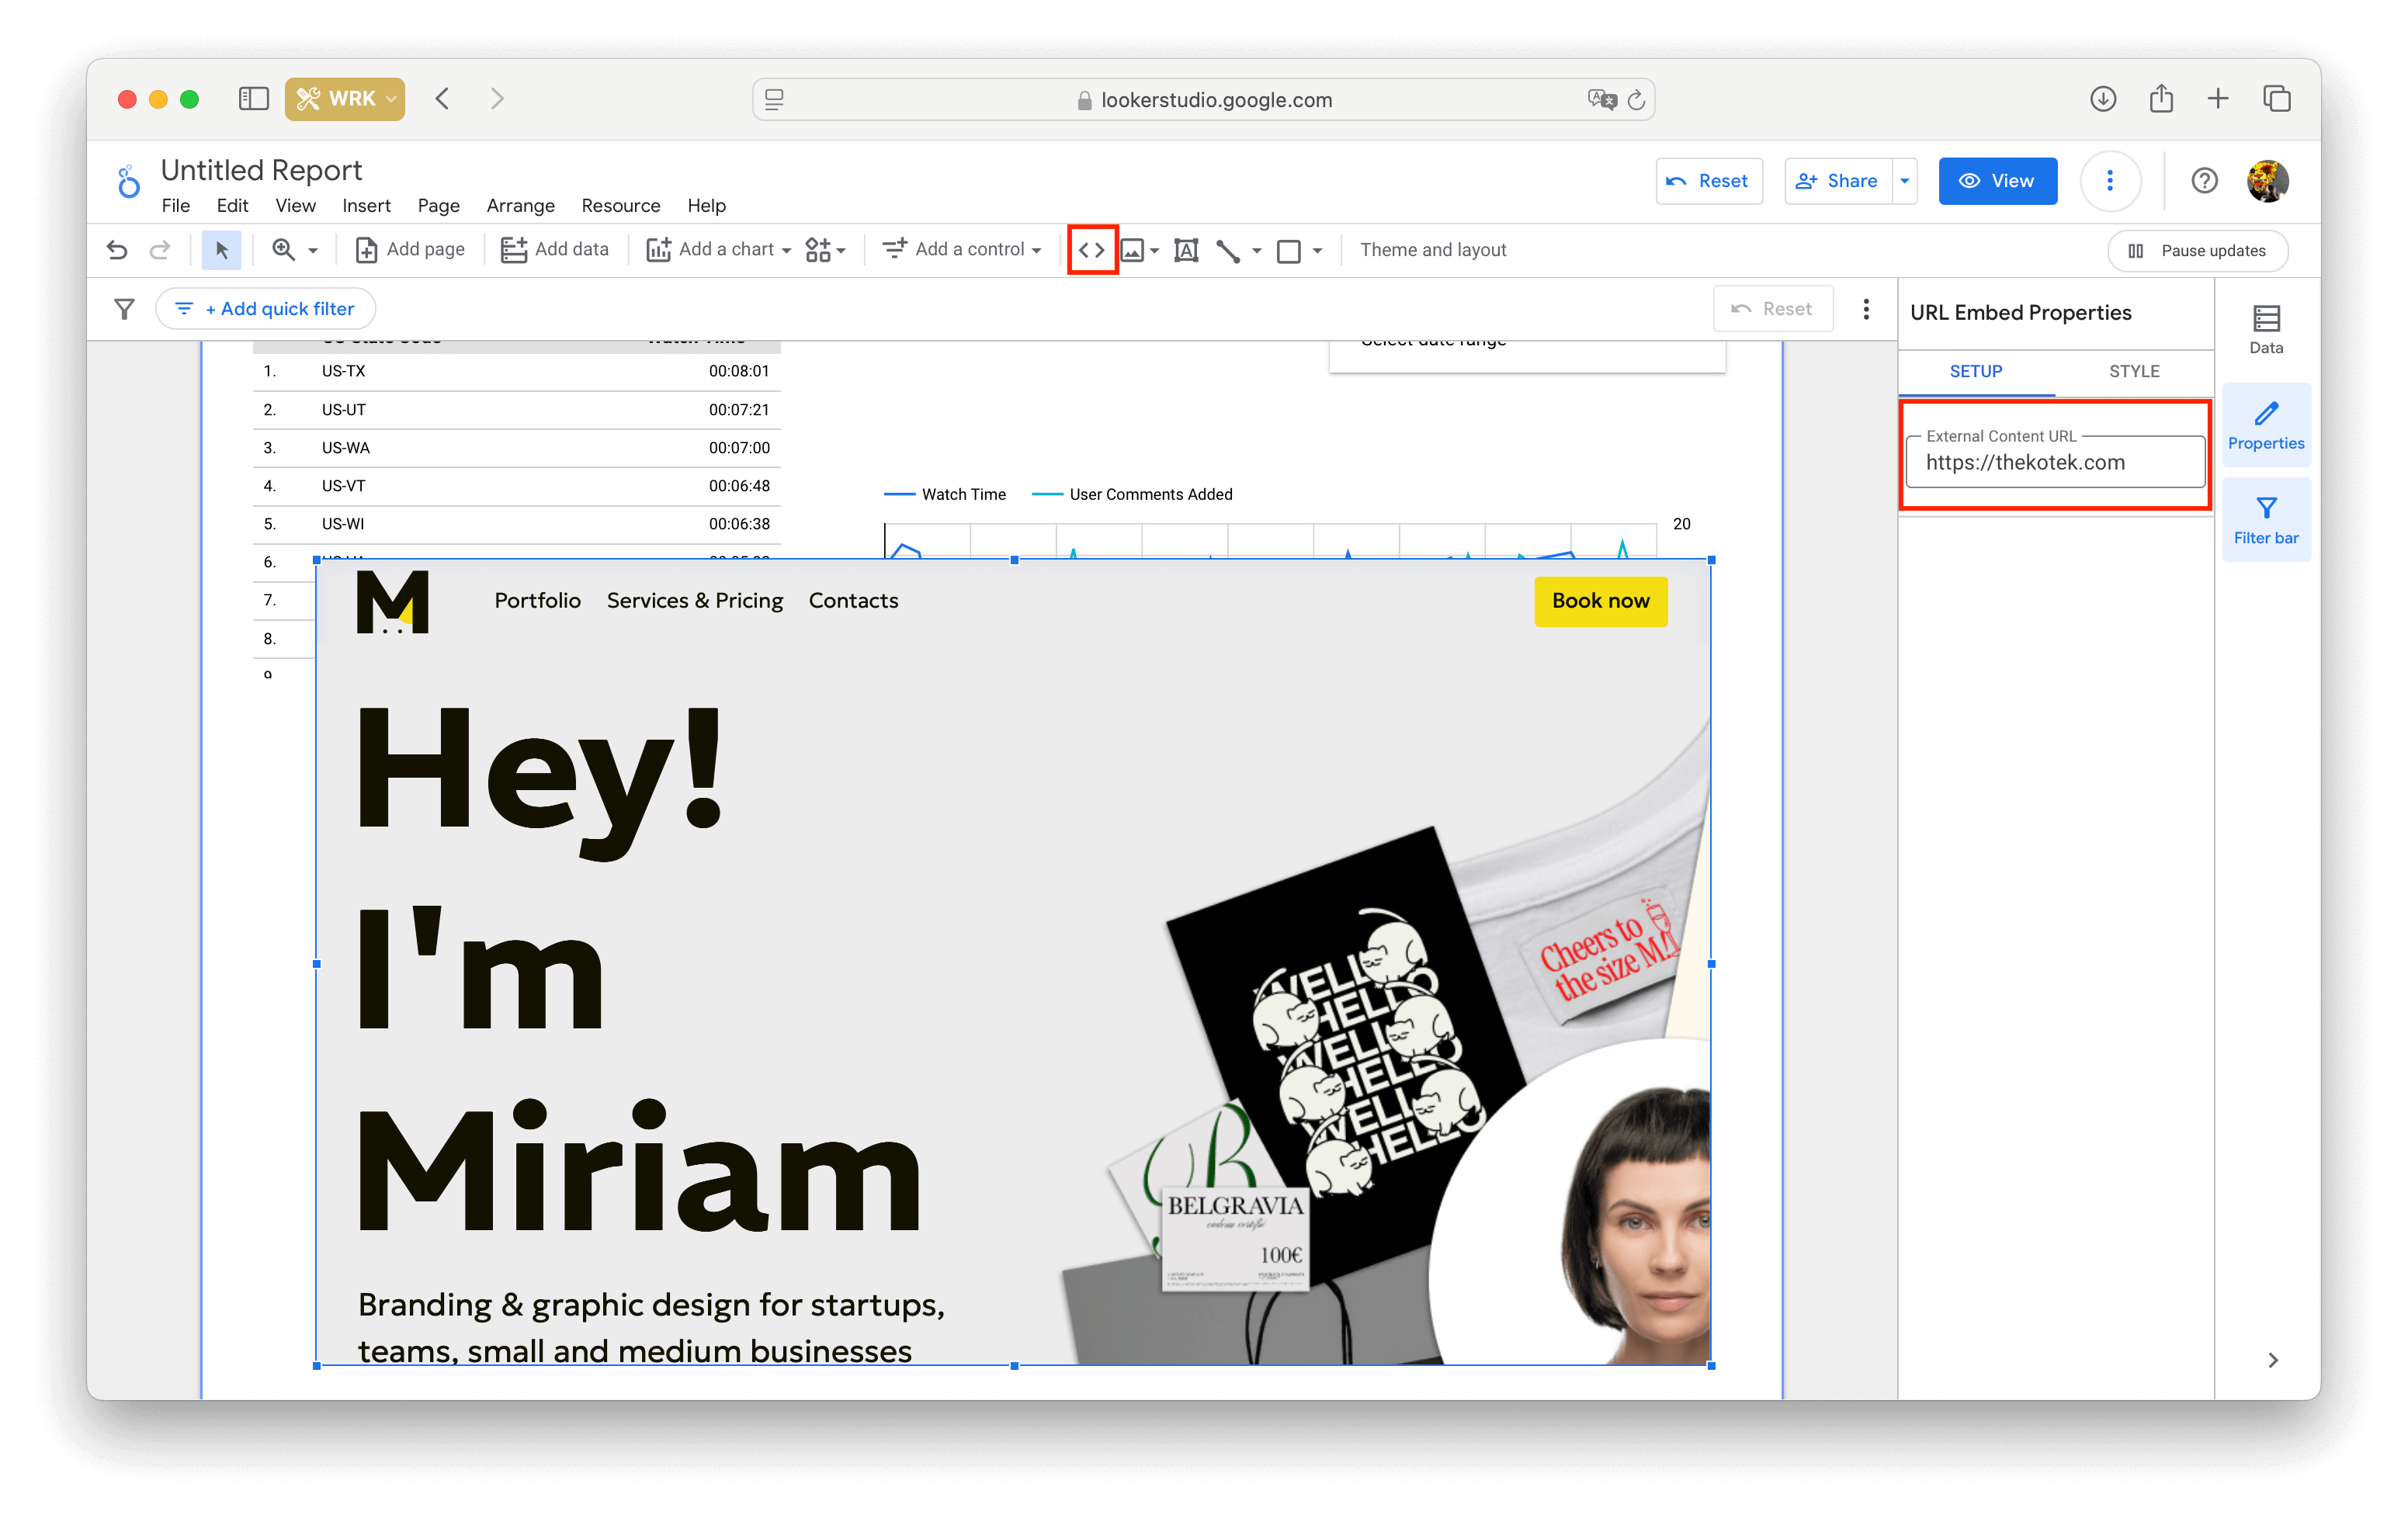
An embedded element is an iframe component that displays another website in real time. You can embed a blog, an online calculator, or even the Data Studio landing page itself.
Pages within the iframe are interactive — you can, for instance, calculate a sum within the same window without leaving your report. However, you won't be able to examine your report and check Facebook at the same time: some websites restrict embedding their content through iframes. In these cases, you'll see a red warning that says 'Can't embed due to provider site restrictions'. Unfortunately, there's no way to get around these restrictions.
To add an external resource to your report, drag the embedded element, type the link, and press Enter.
Images
You can add images from your computer or via a link. The image should be fully prepared — you won't be able to crop or edit it in Looker Studio; all you can do is resize it and adjust the border.
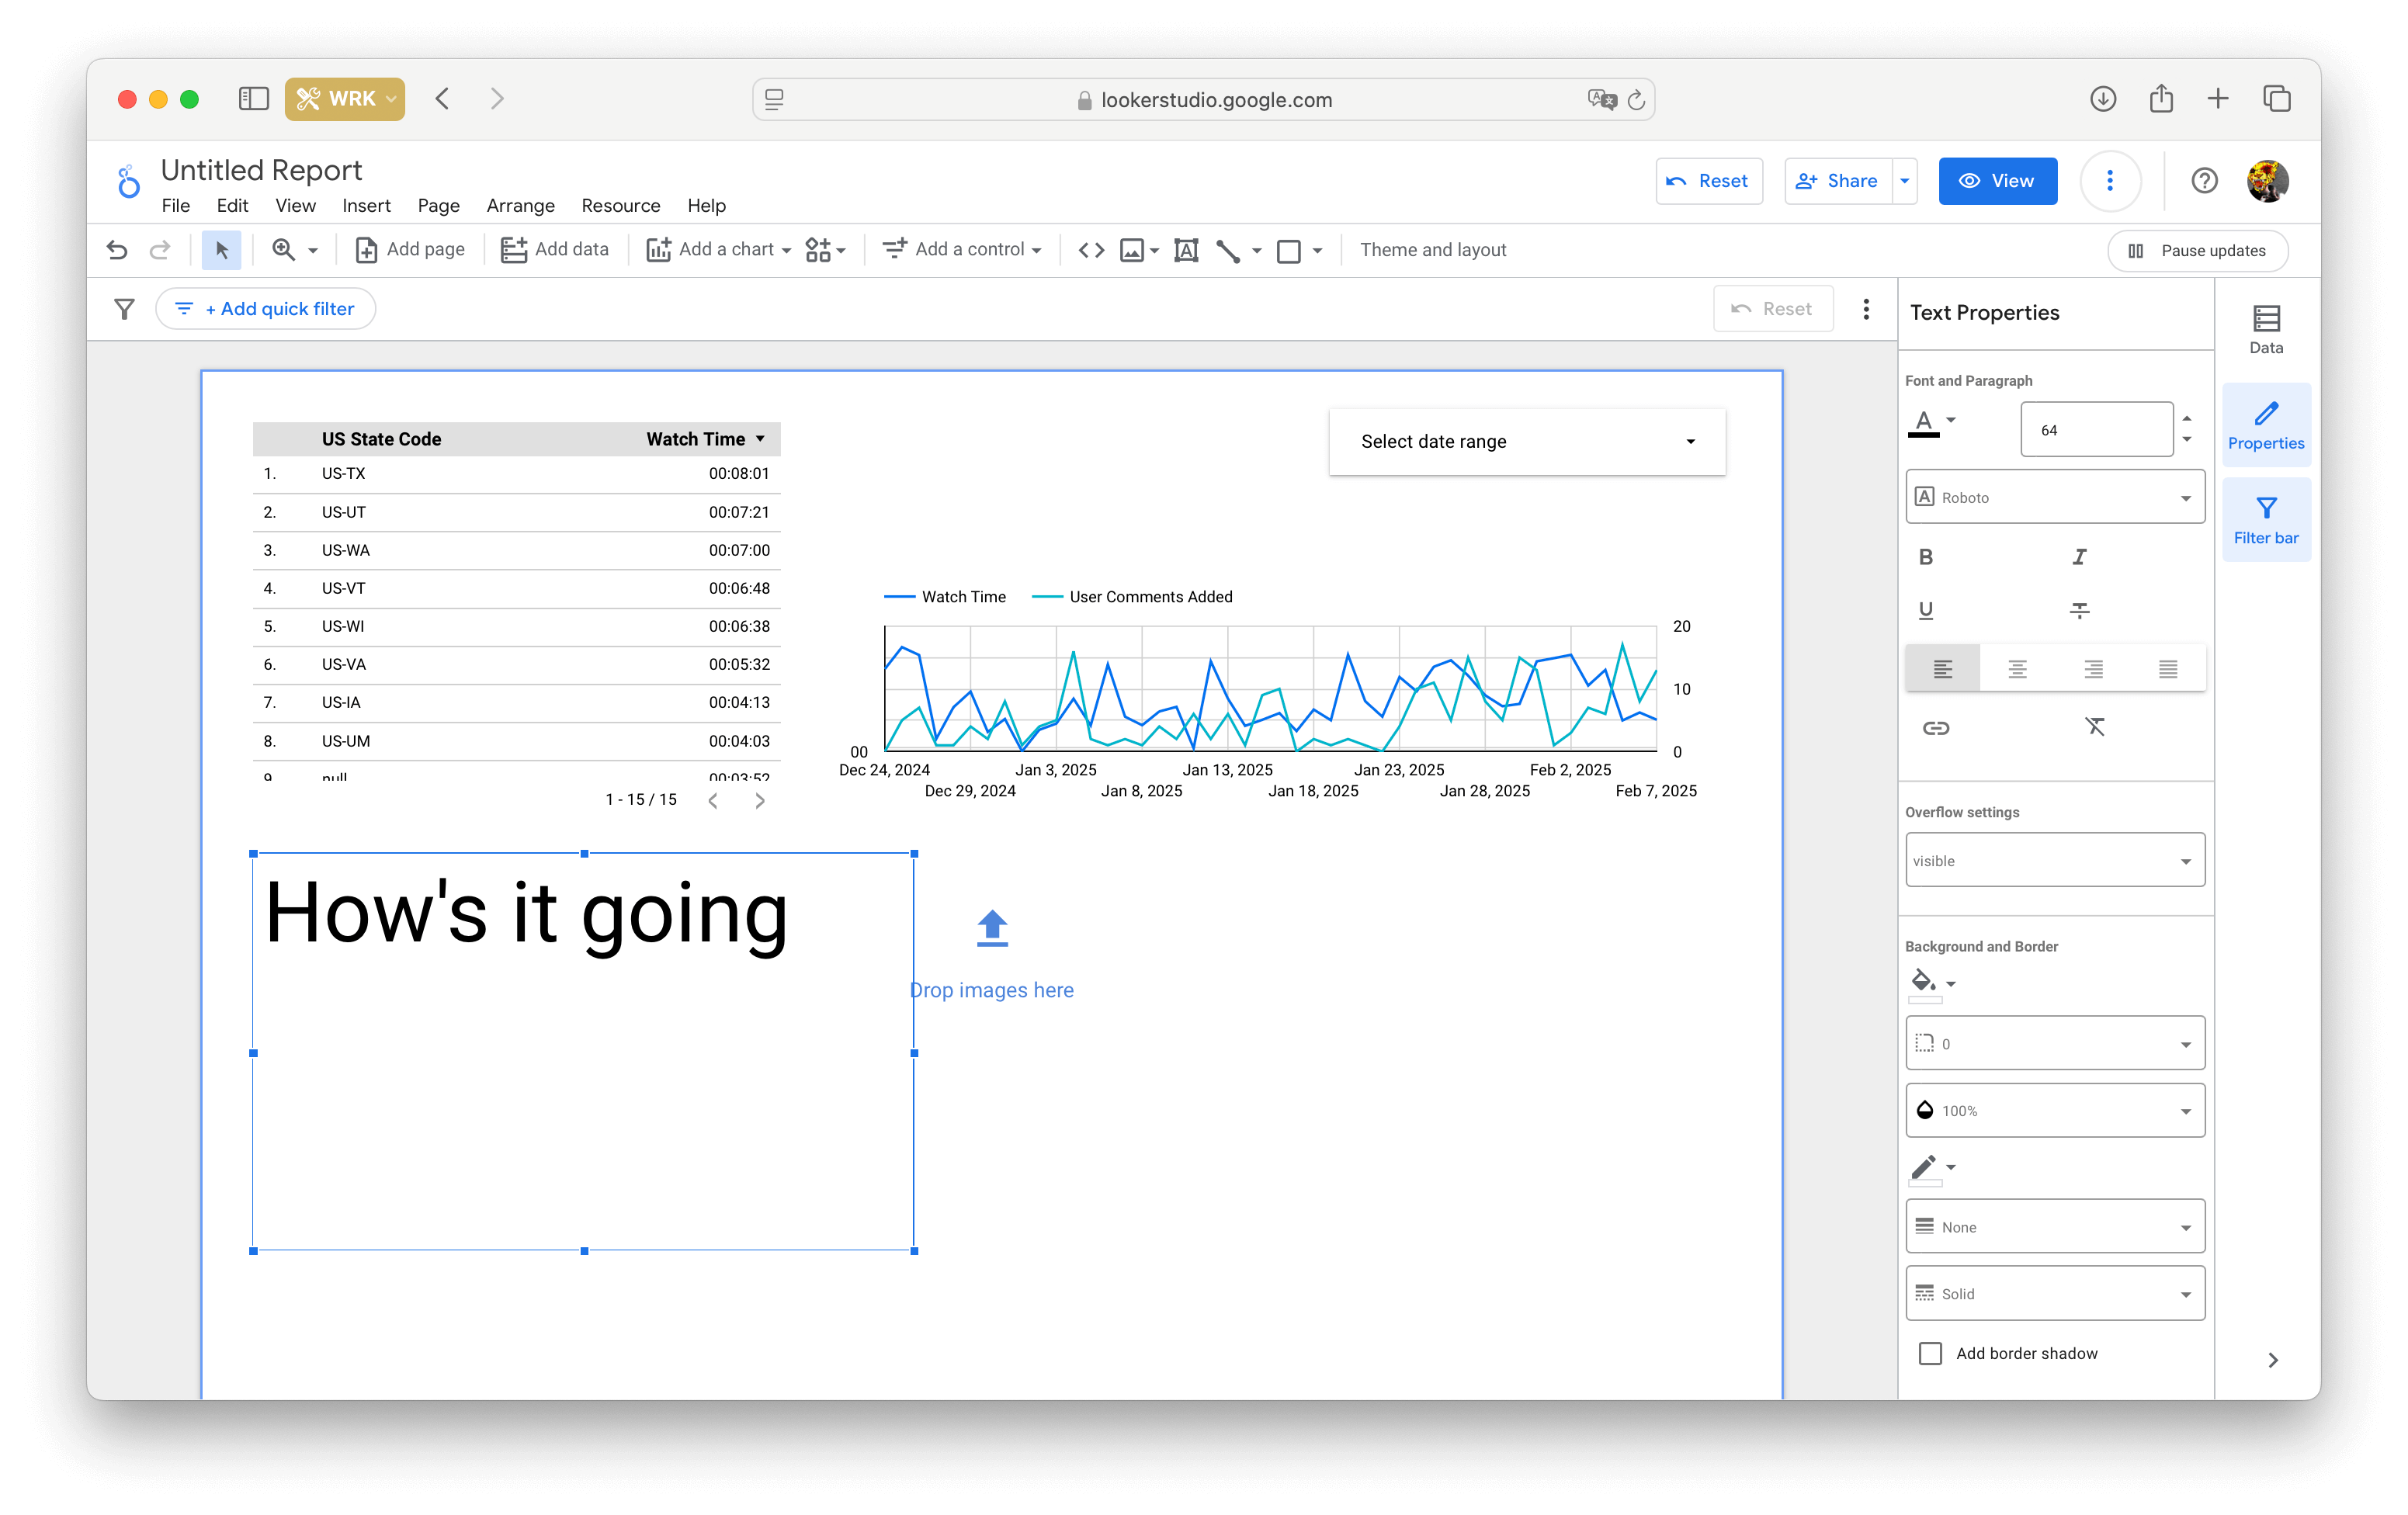
Text
Standard text tools are available:
- color
- font (38 standard options are available, but custom fonts aren't supported)
- style (bold, italic, underlined, strikethrough)
- size (from 8 to 96 pixels)
- alignment
- show/hide text outside of an element
- element background and border settings
- line height and padding
You can add links to the text — both to external Web sites and to pages within your report.
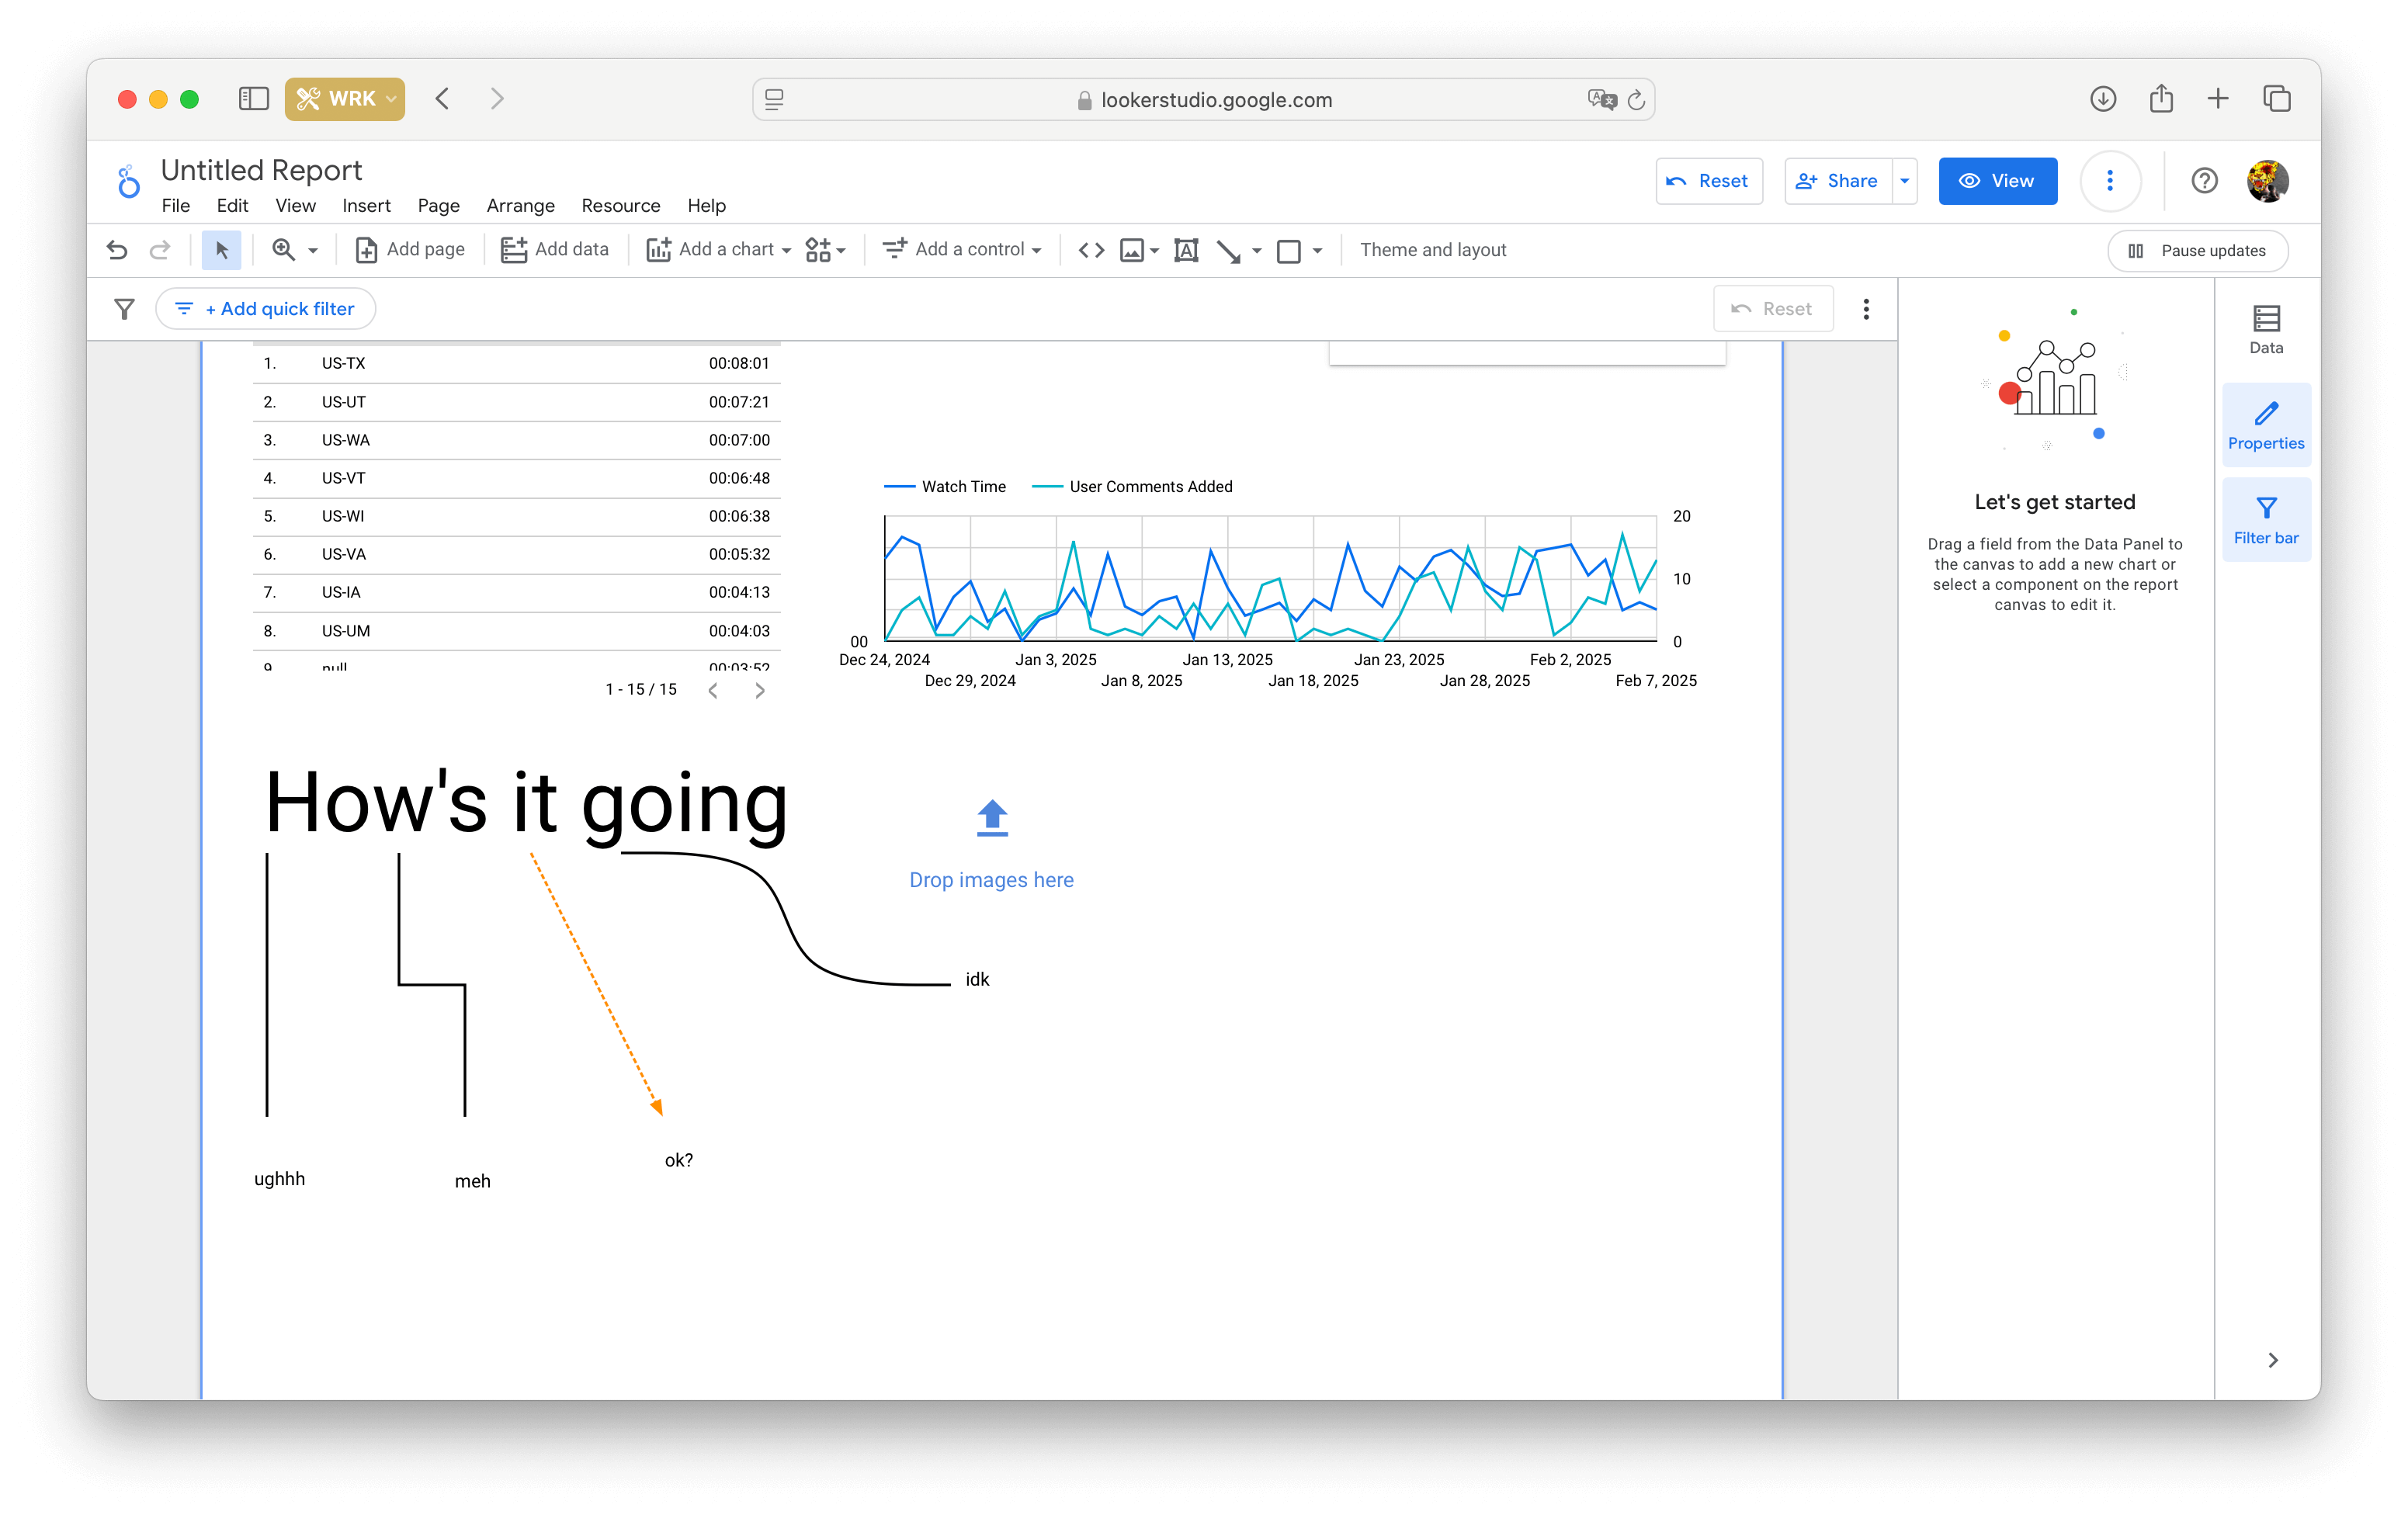
Lines and arrows
Looker Studio provides four types of lines:
- straight
- with straight corners
- smooth curve
- arrow
Each line type can be customized for thickness, color, line style, start and end points (which can be a circle, triangle or arrowhead — their color and size are also adjustable).
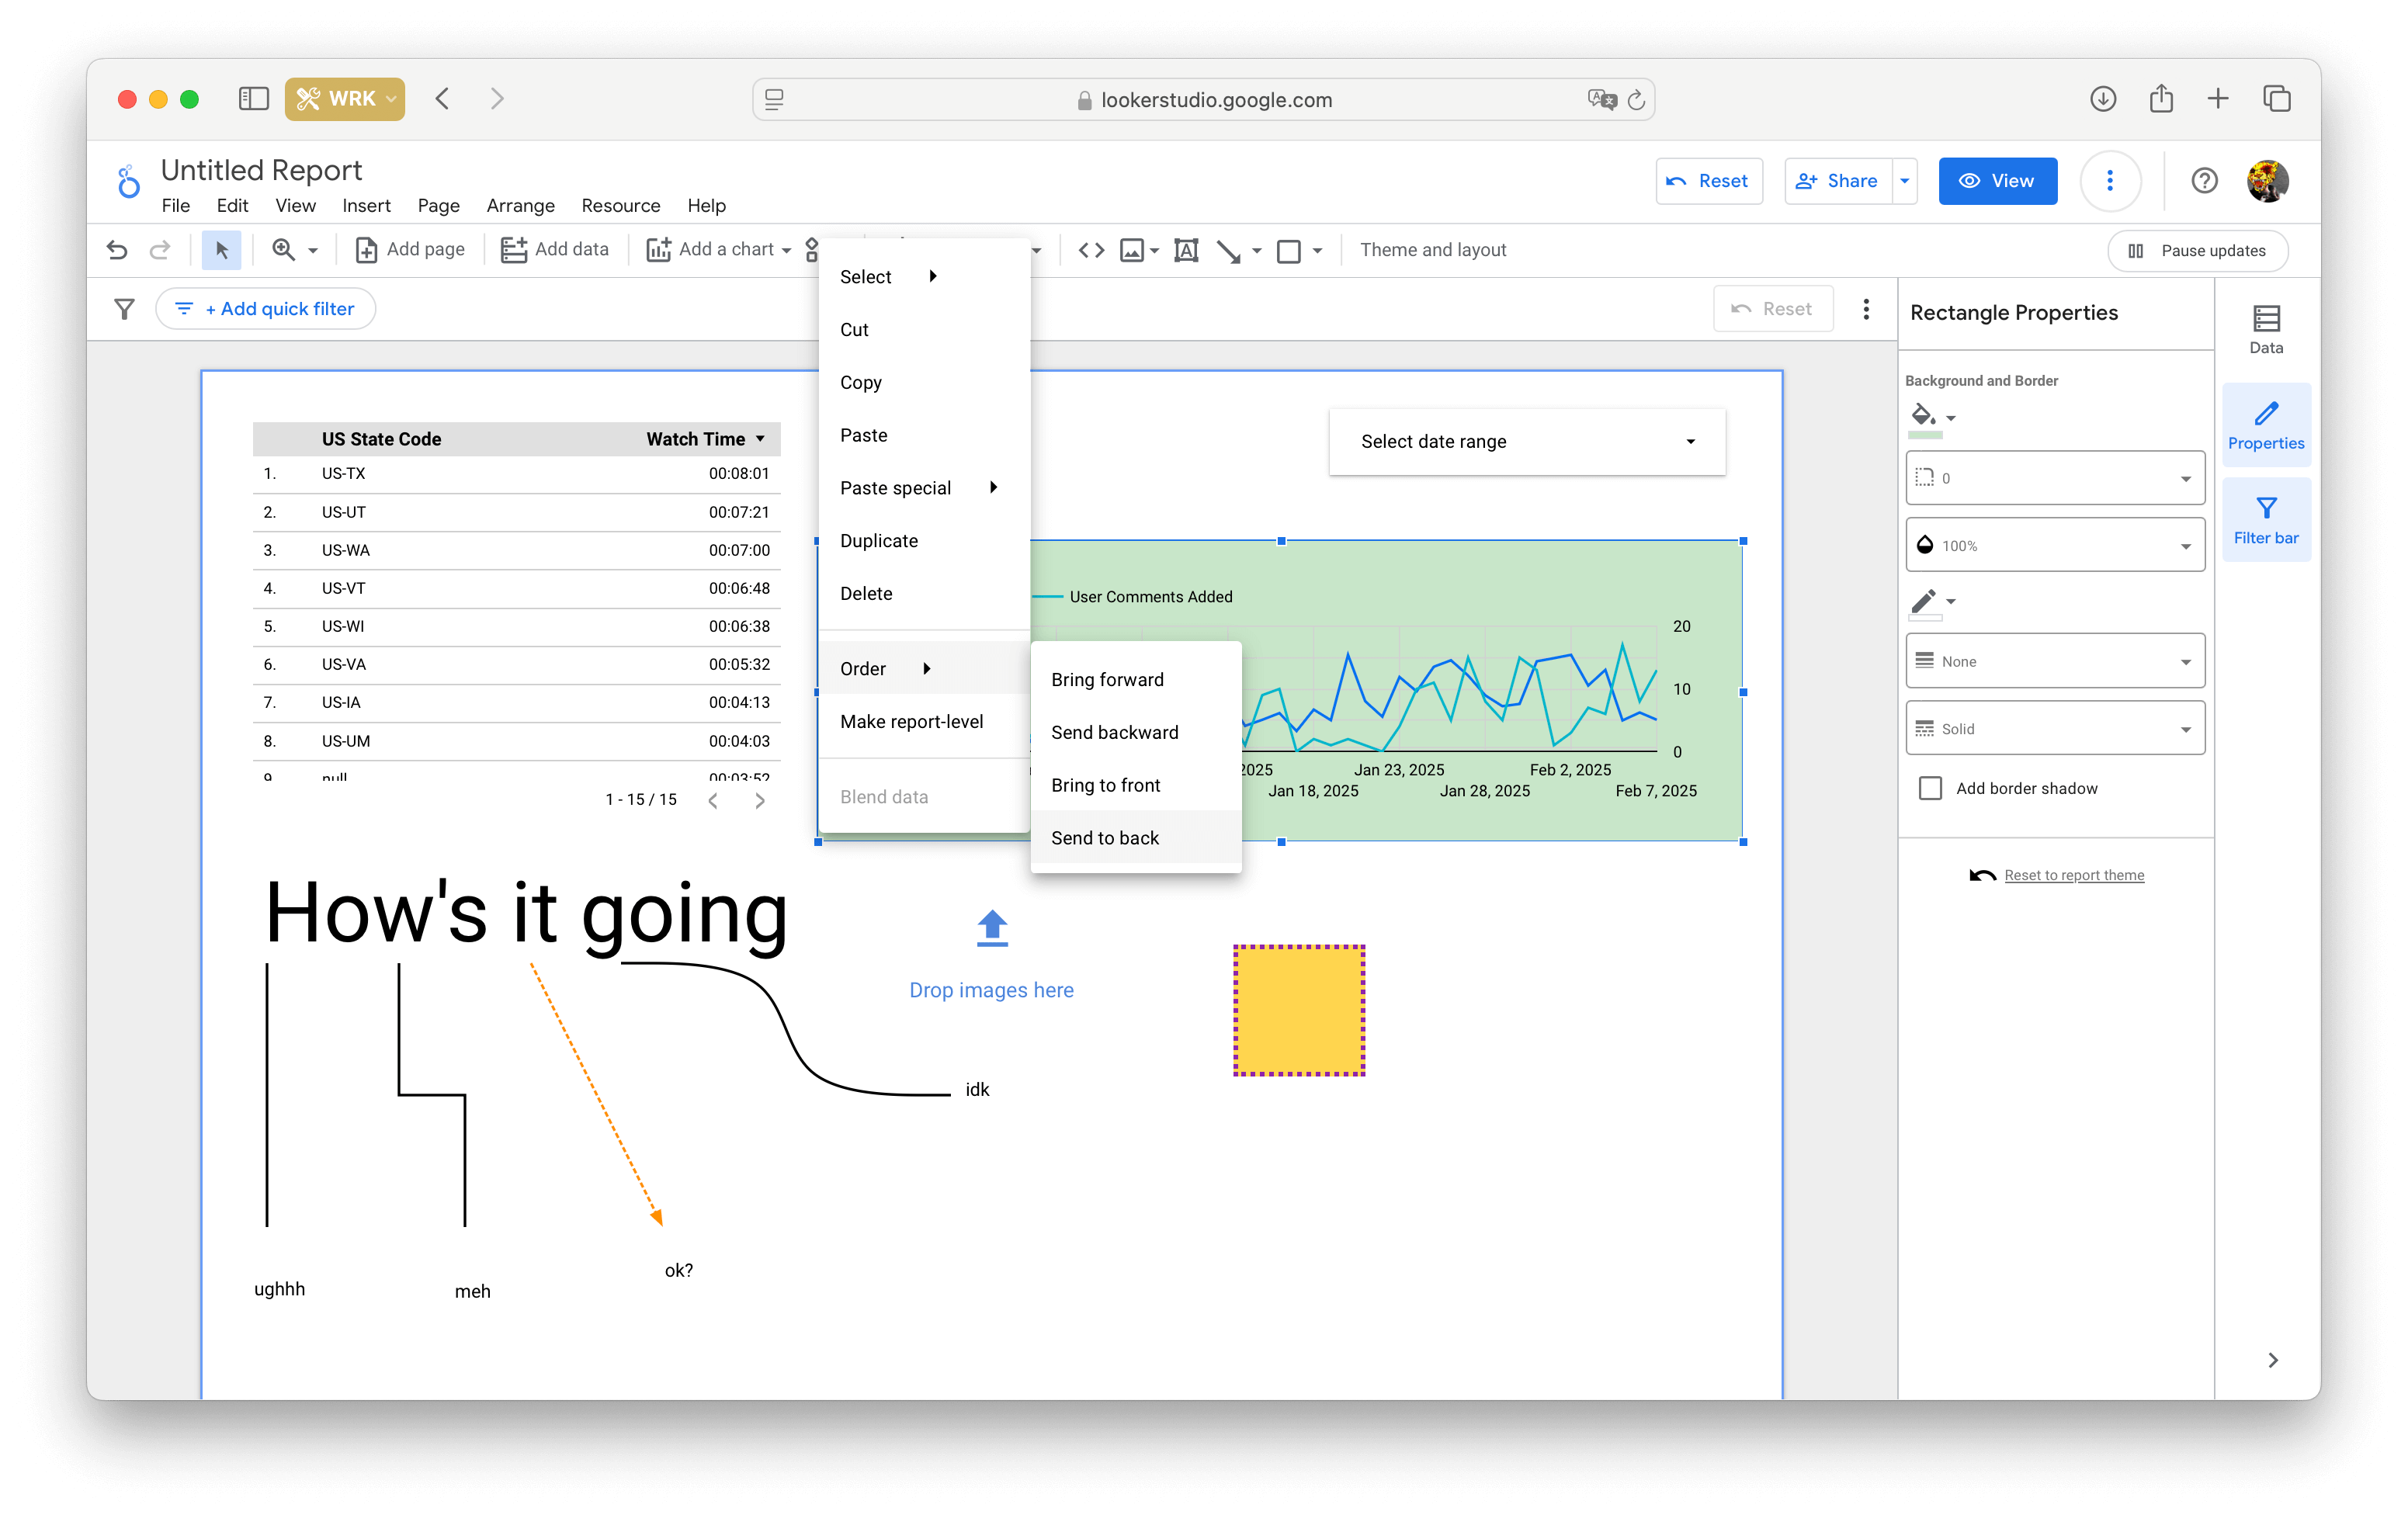
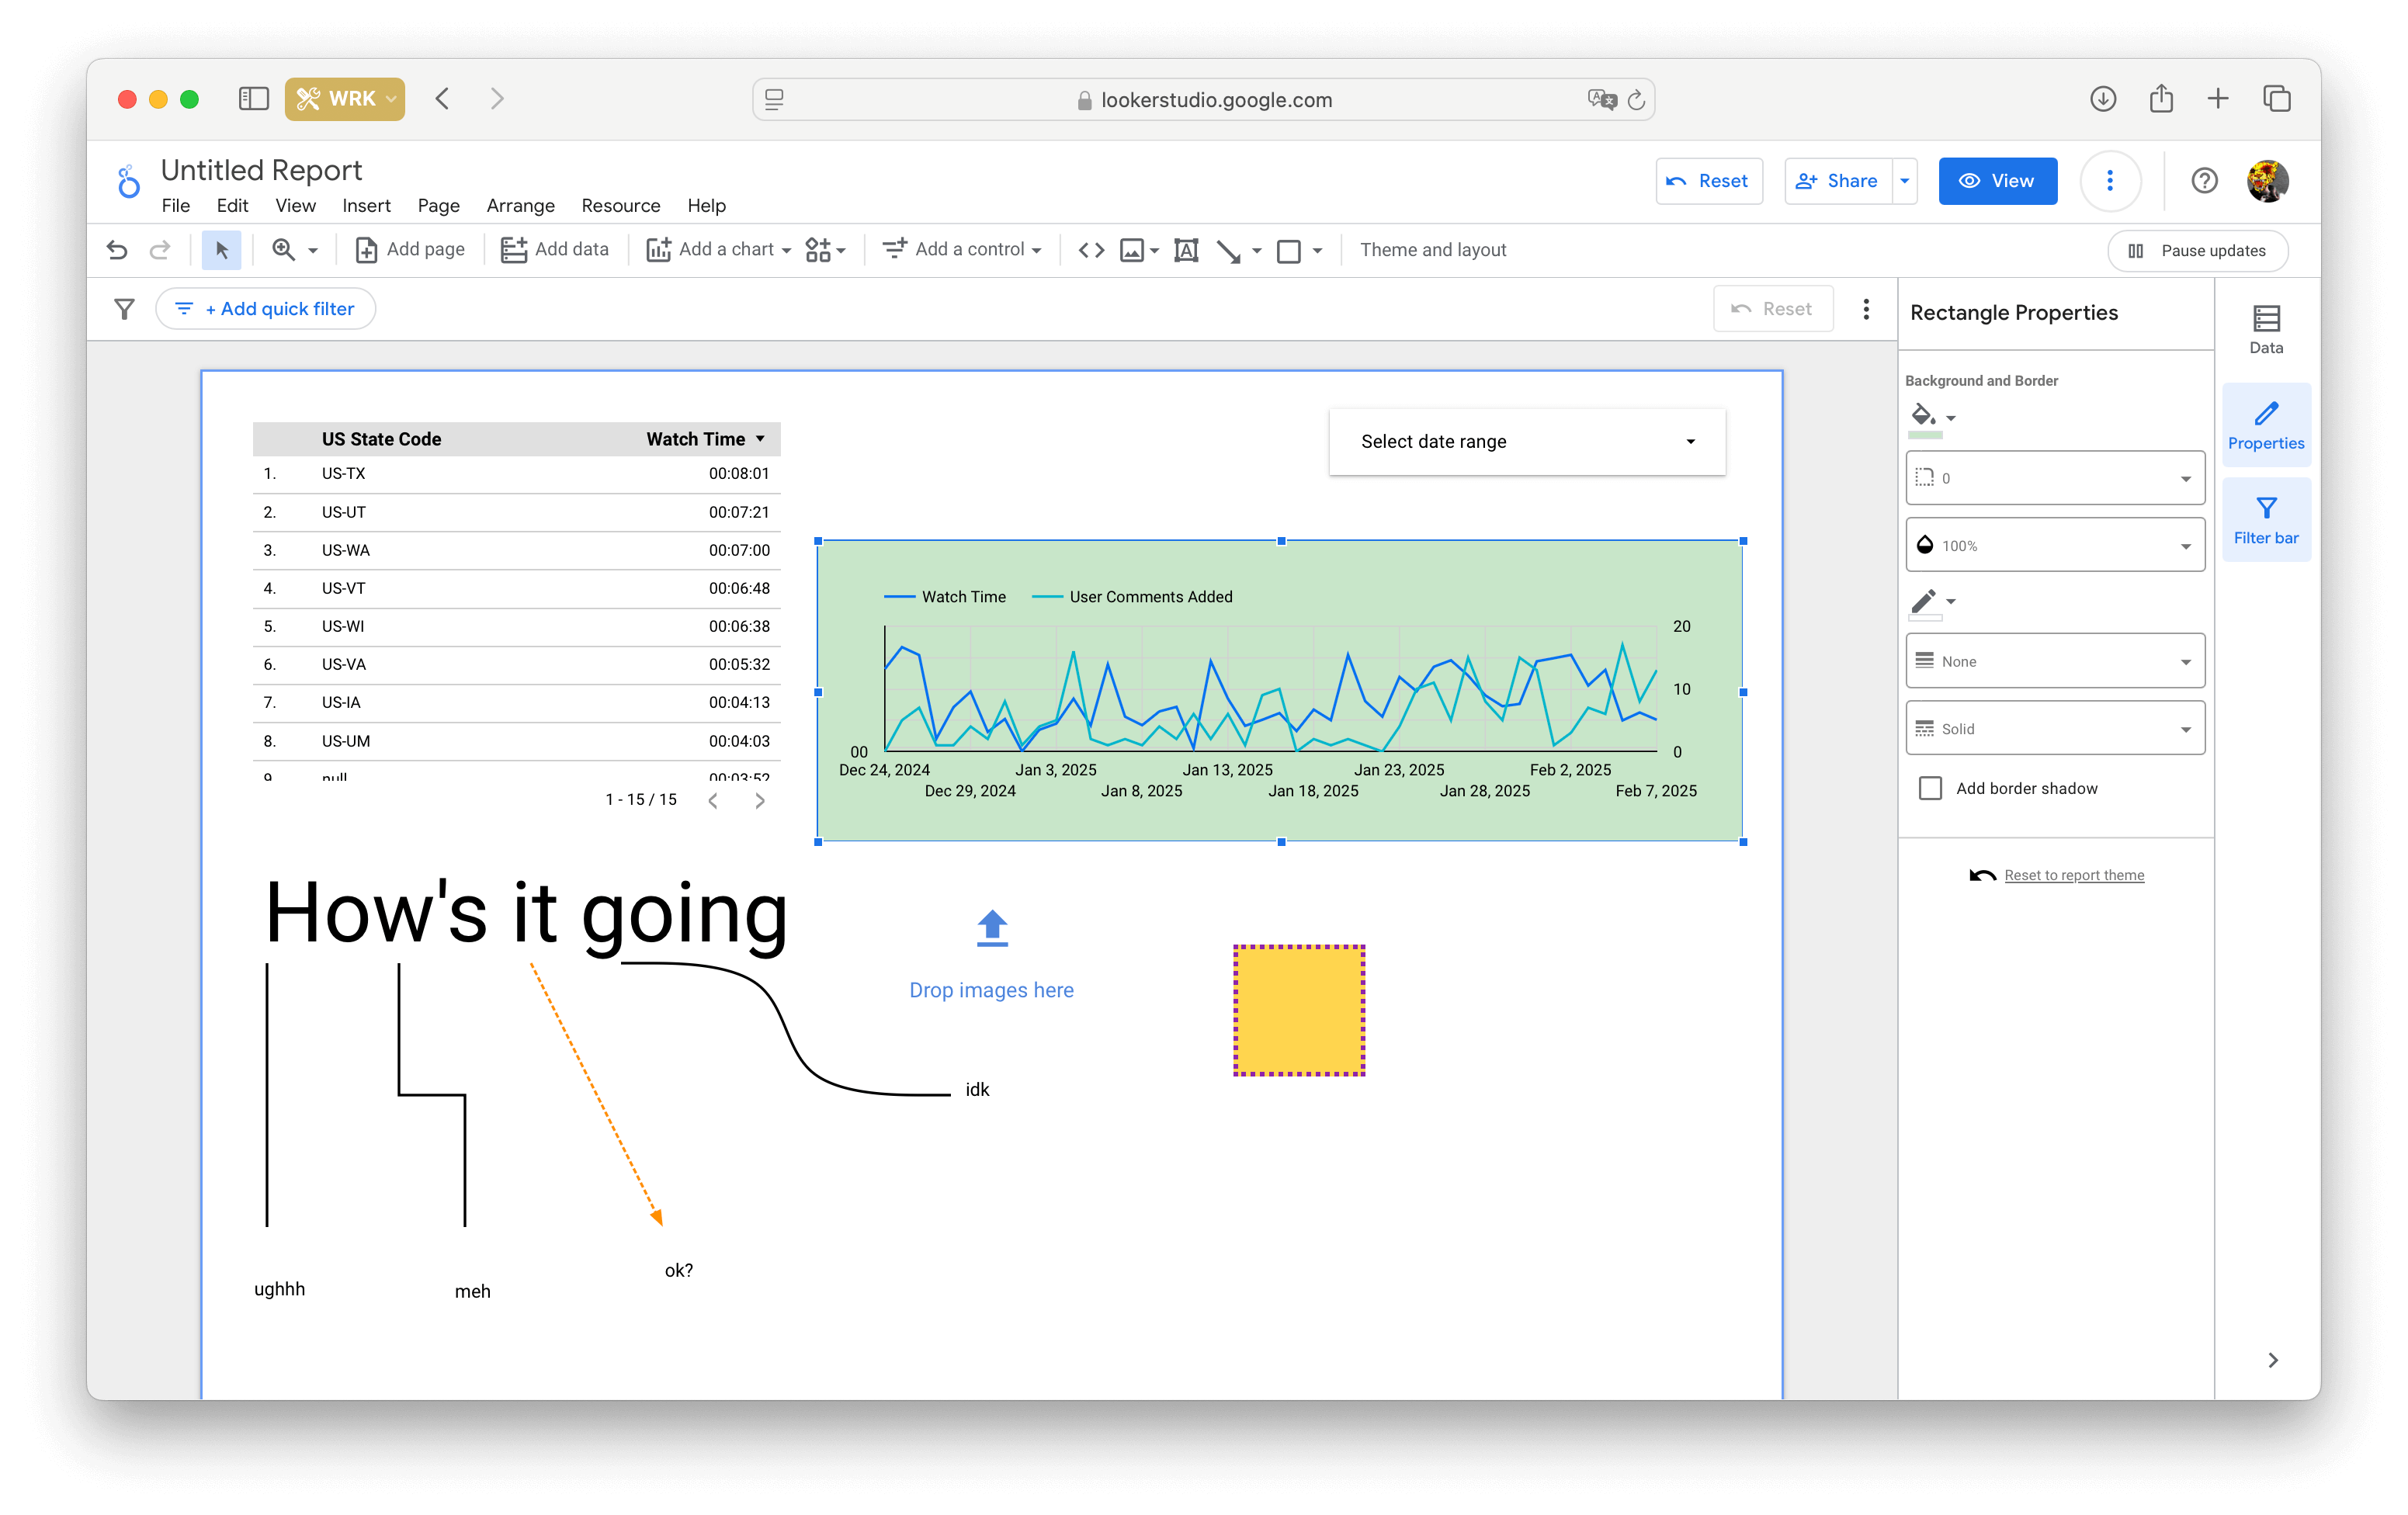
Shapes
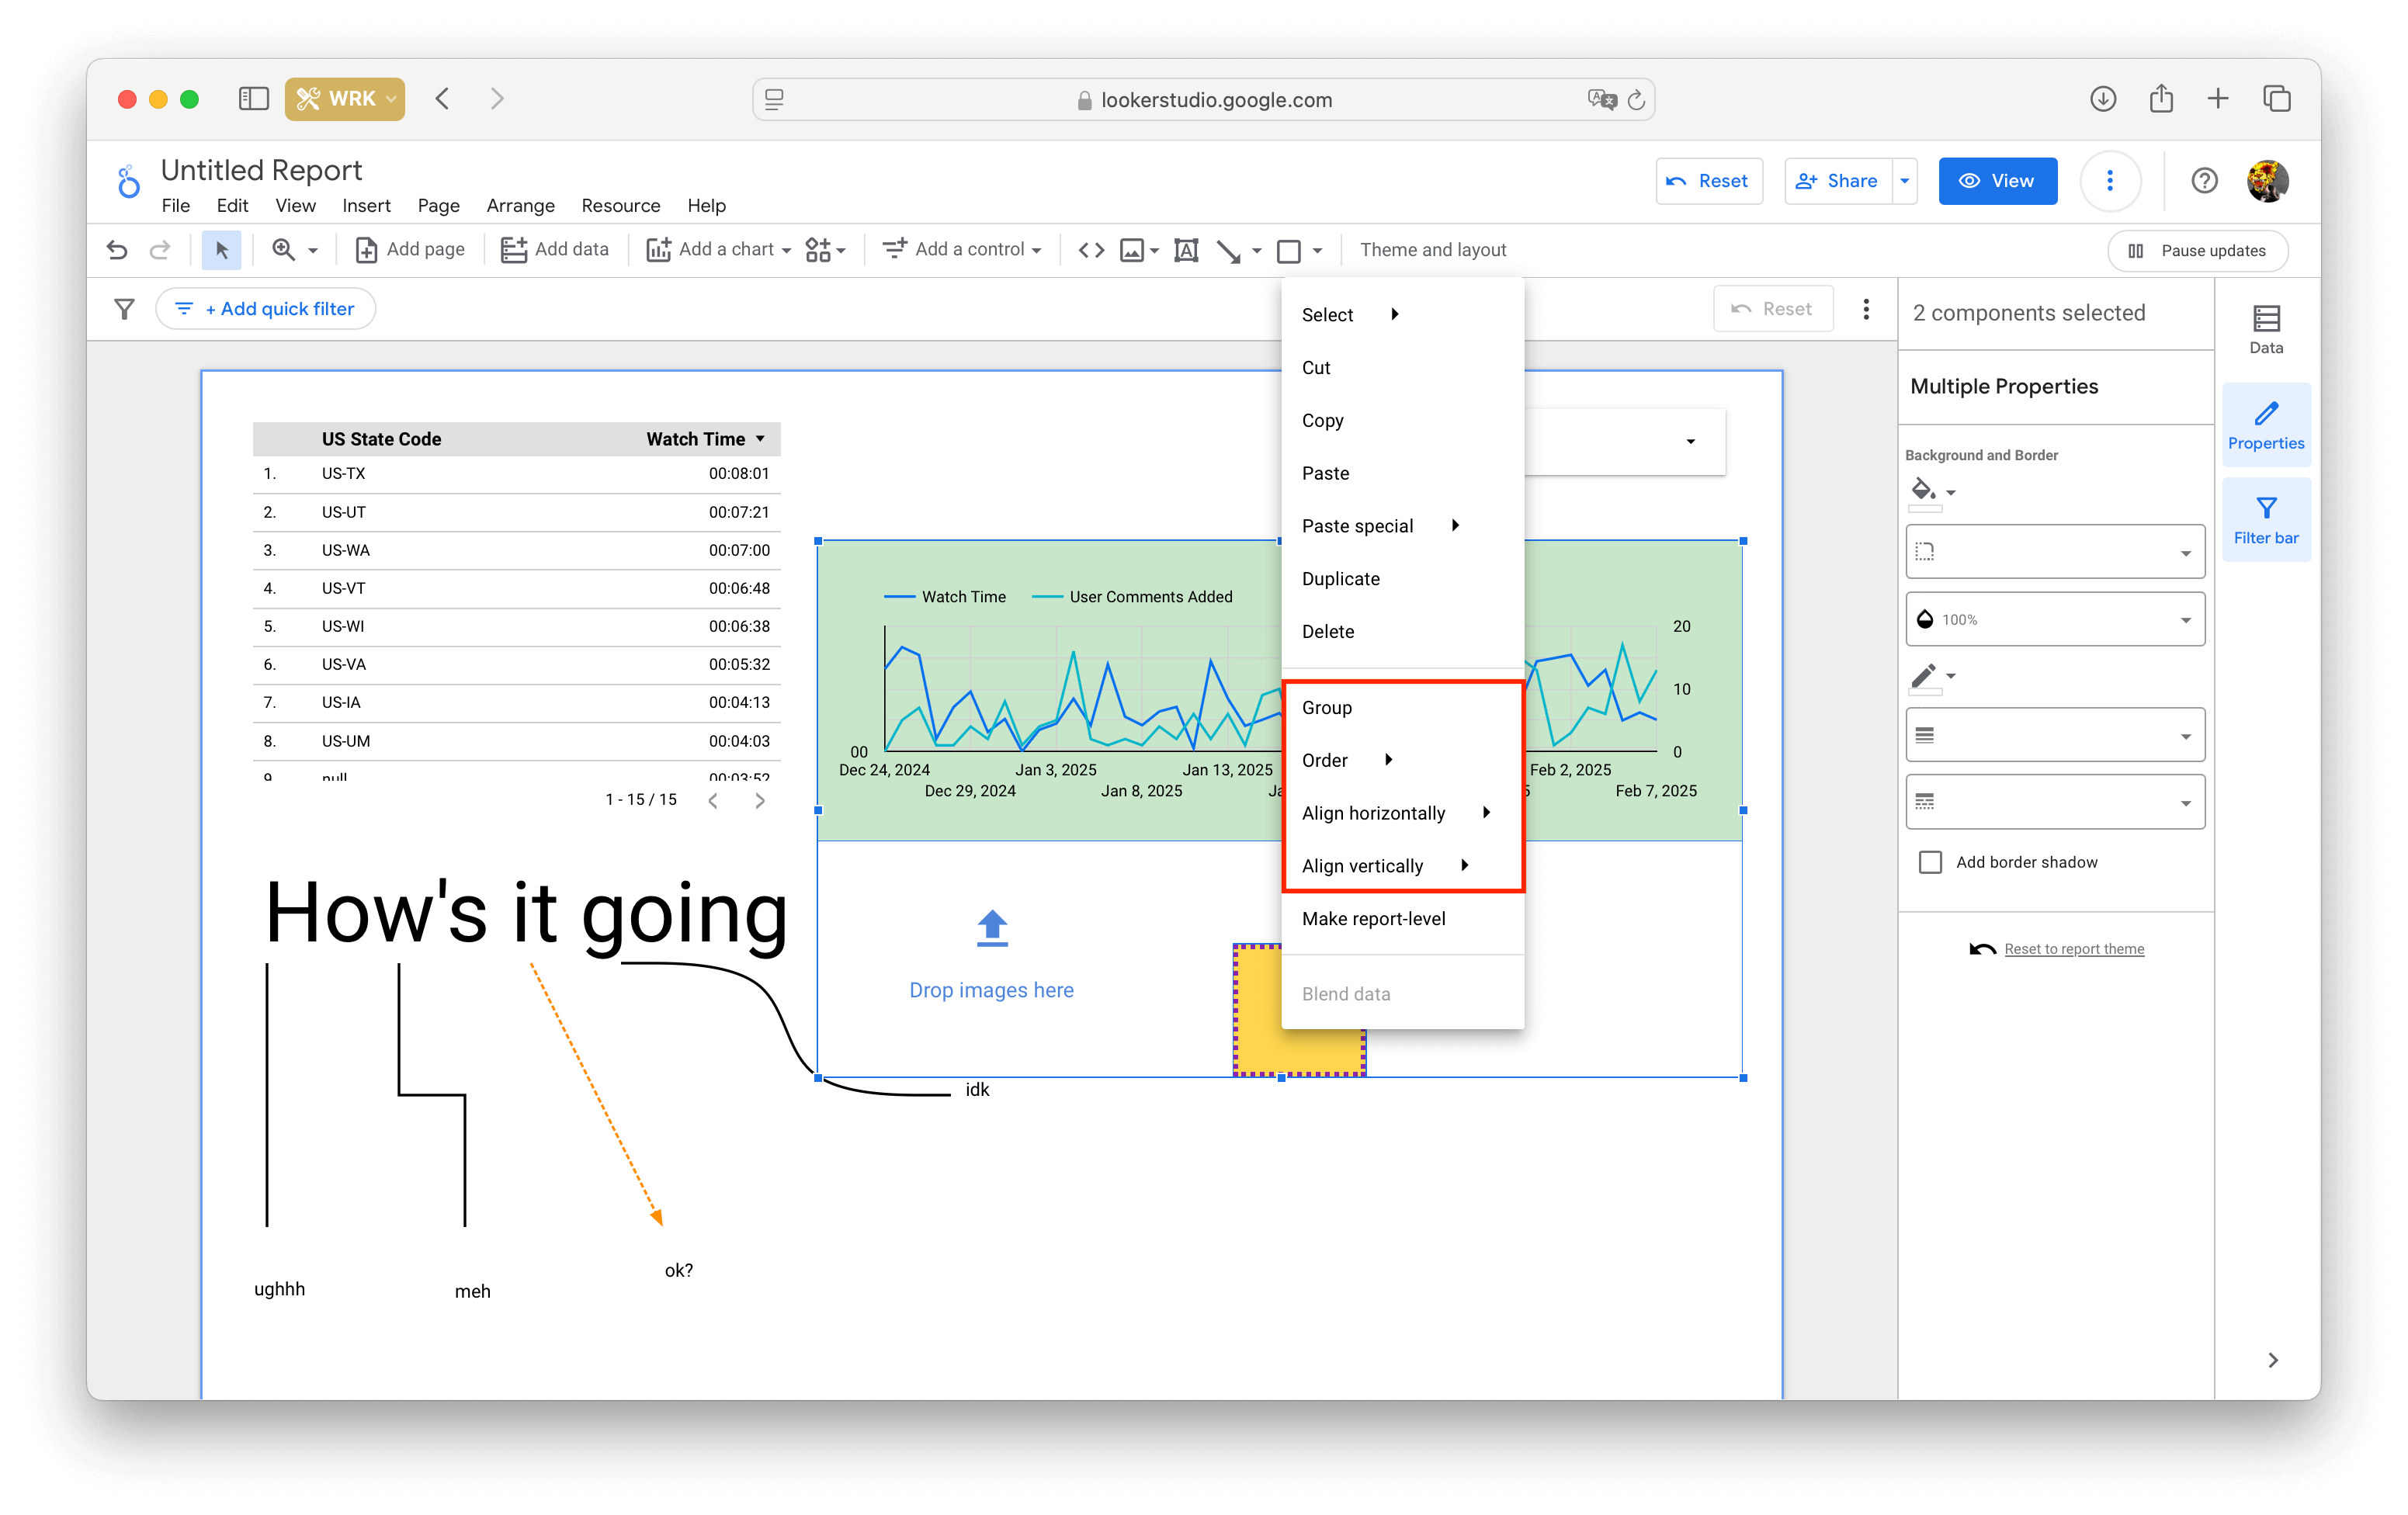
Only rectangles and circles are available, but they can be customized a bit. In addition to background and border settings, you can adjust transparency, corner radius, and even add a small, non-adjustable shadow. Positioning of shapes (sending to front or background) is in the right-click menu.
Select multiple shapes by holding down the Shift key while clicking on them — then right-click to open options for grouping/ungrouping and aligning the group.
Filtering data
Filters come in handy when you need to display data that meets certain conditions. With their help, you can create a referrer traffic table that excludes certain domains — or an entire page that shows only data from San Francisco.
Page filter
A page filter is added from the top menu in 'Add a control' section. If you want to exclude all dimensions except one, select the data field in 'Dimensions' and set its default value below.
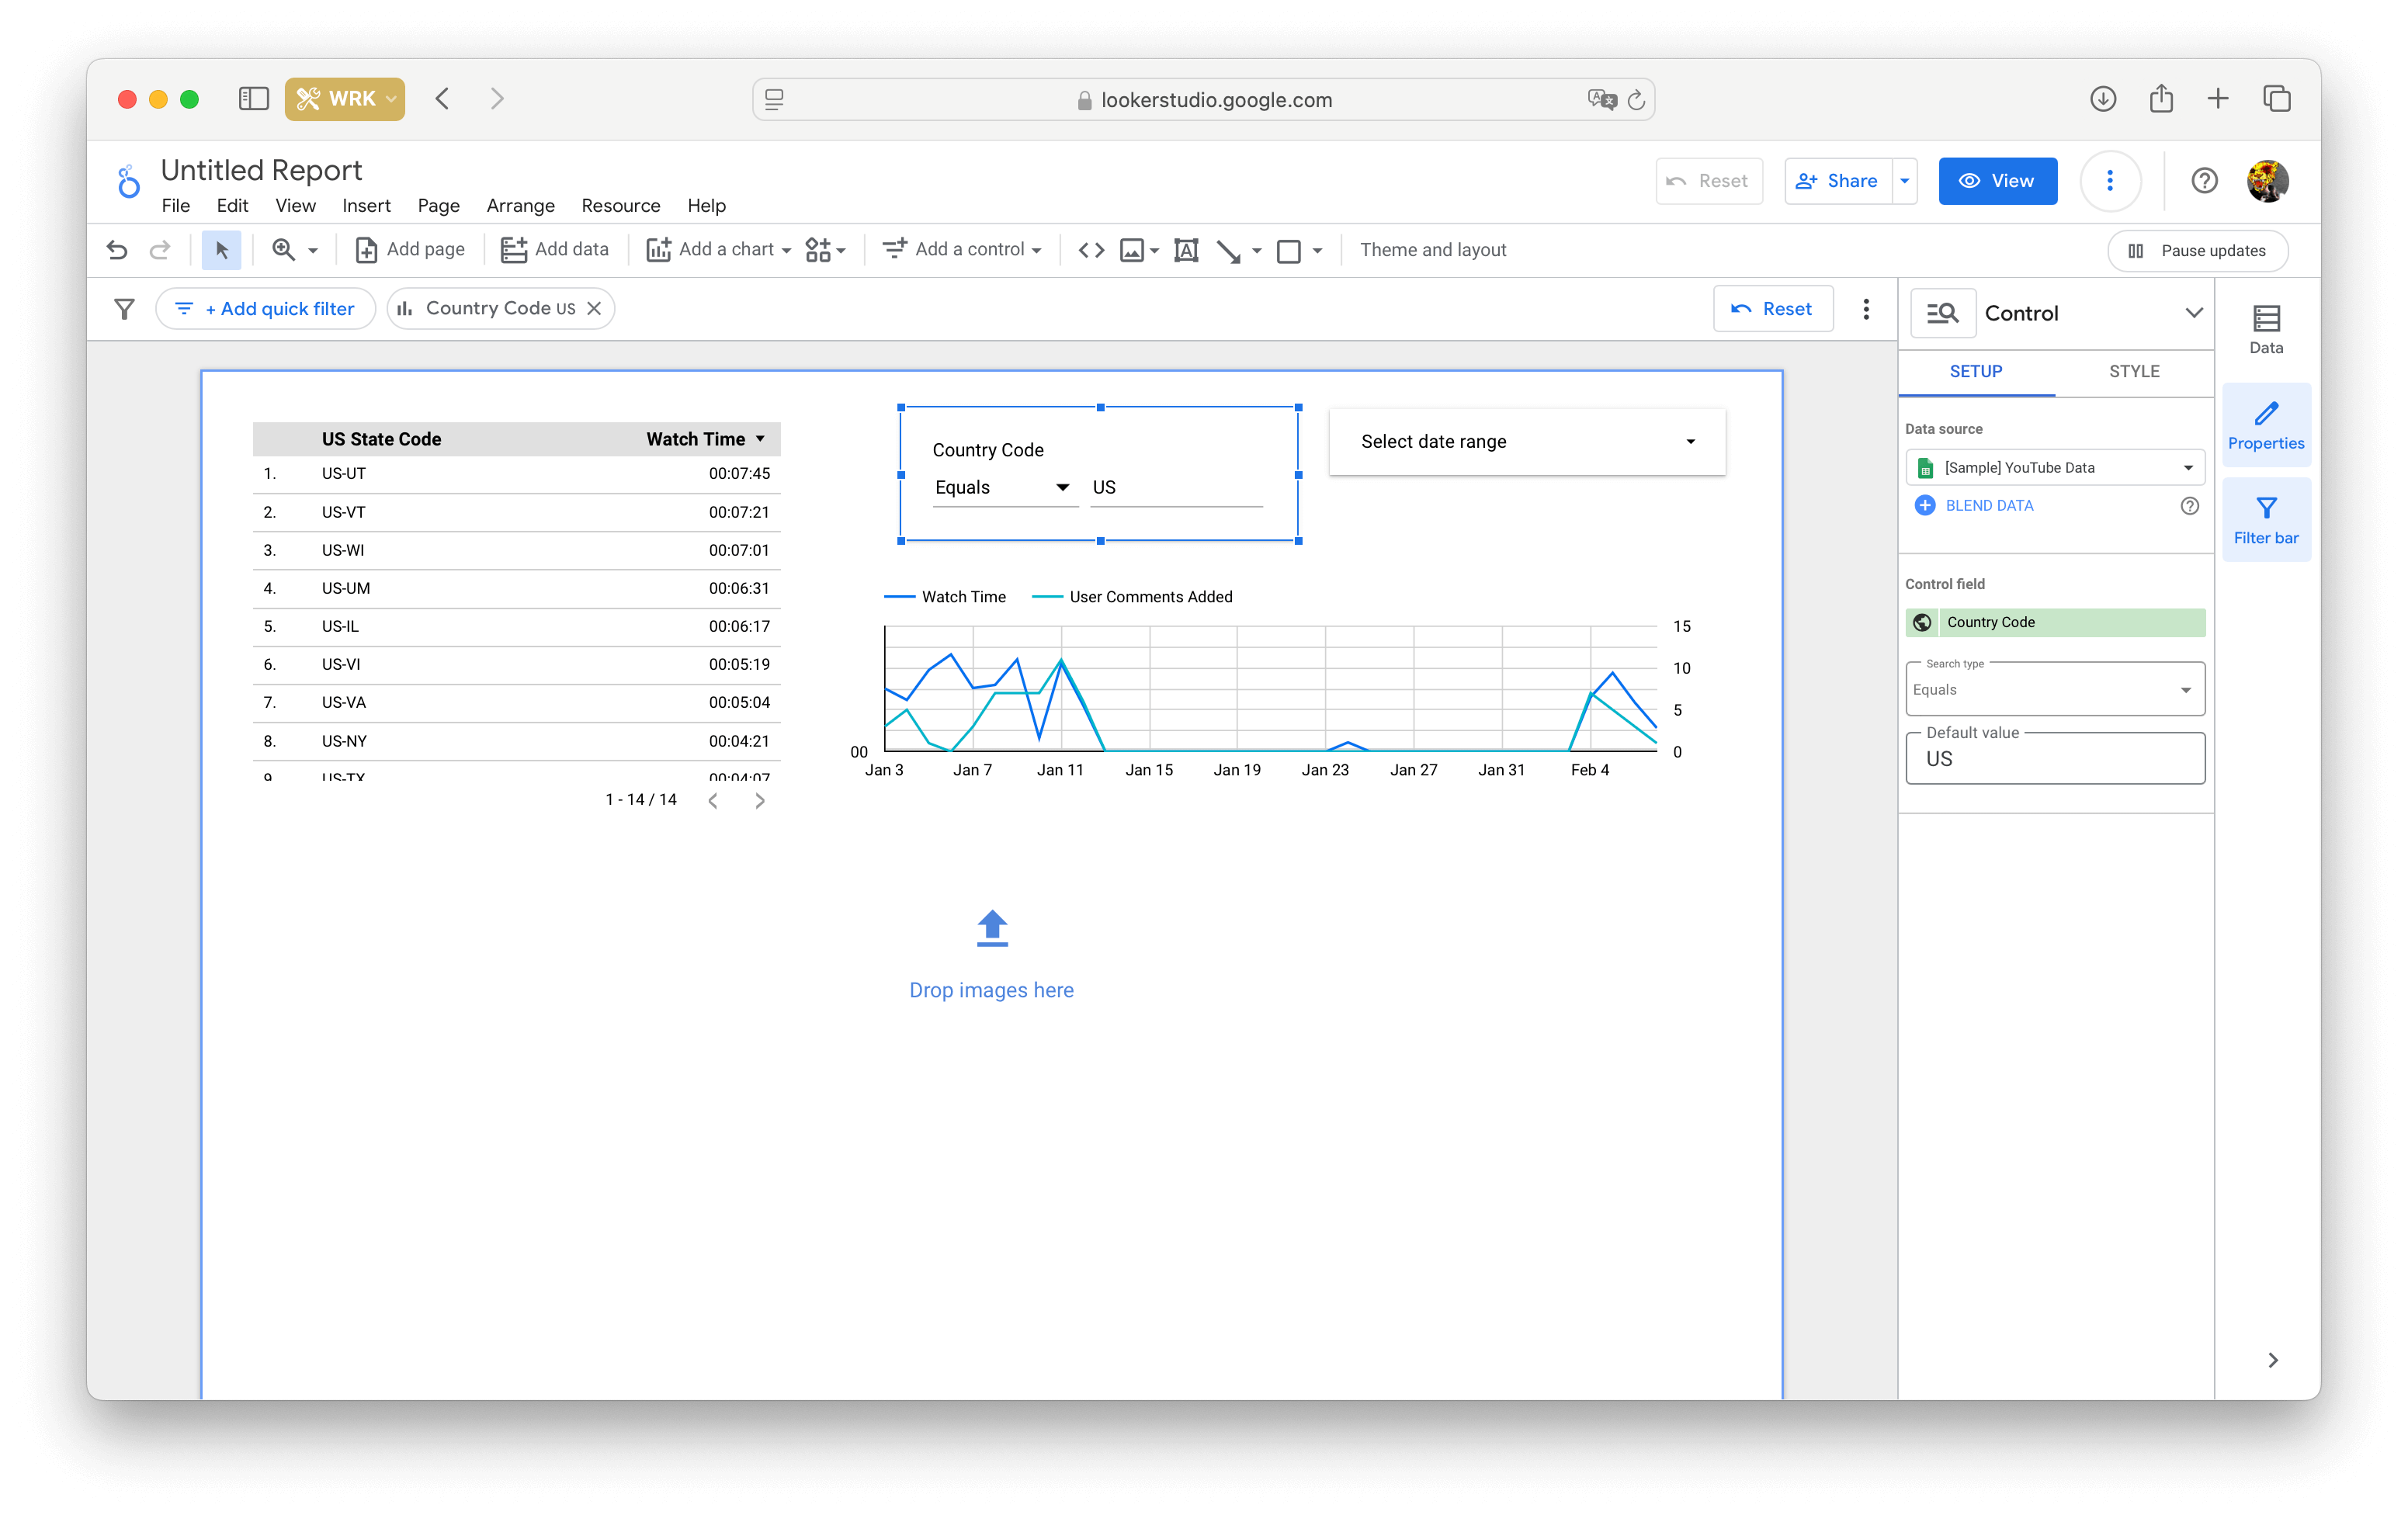
Note that a filter applied to a page only affects the corresponding data source.
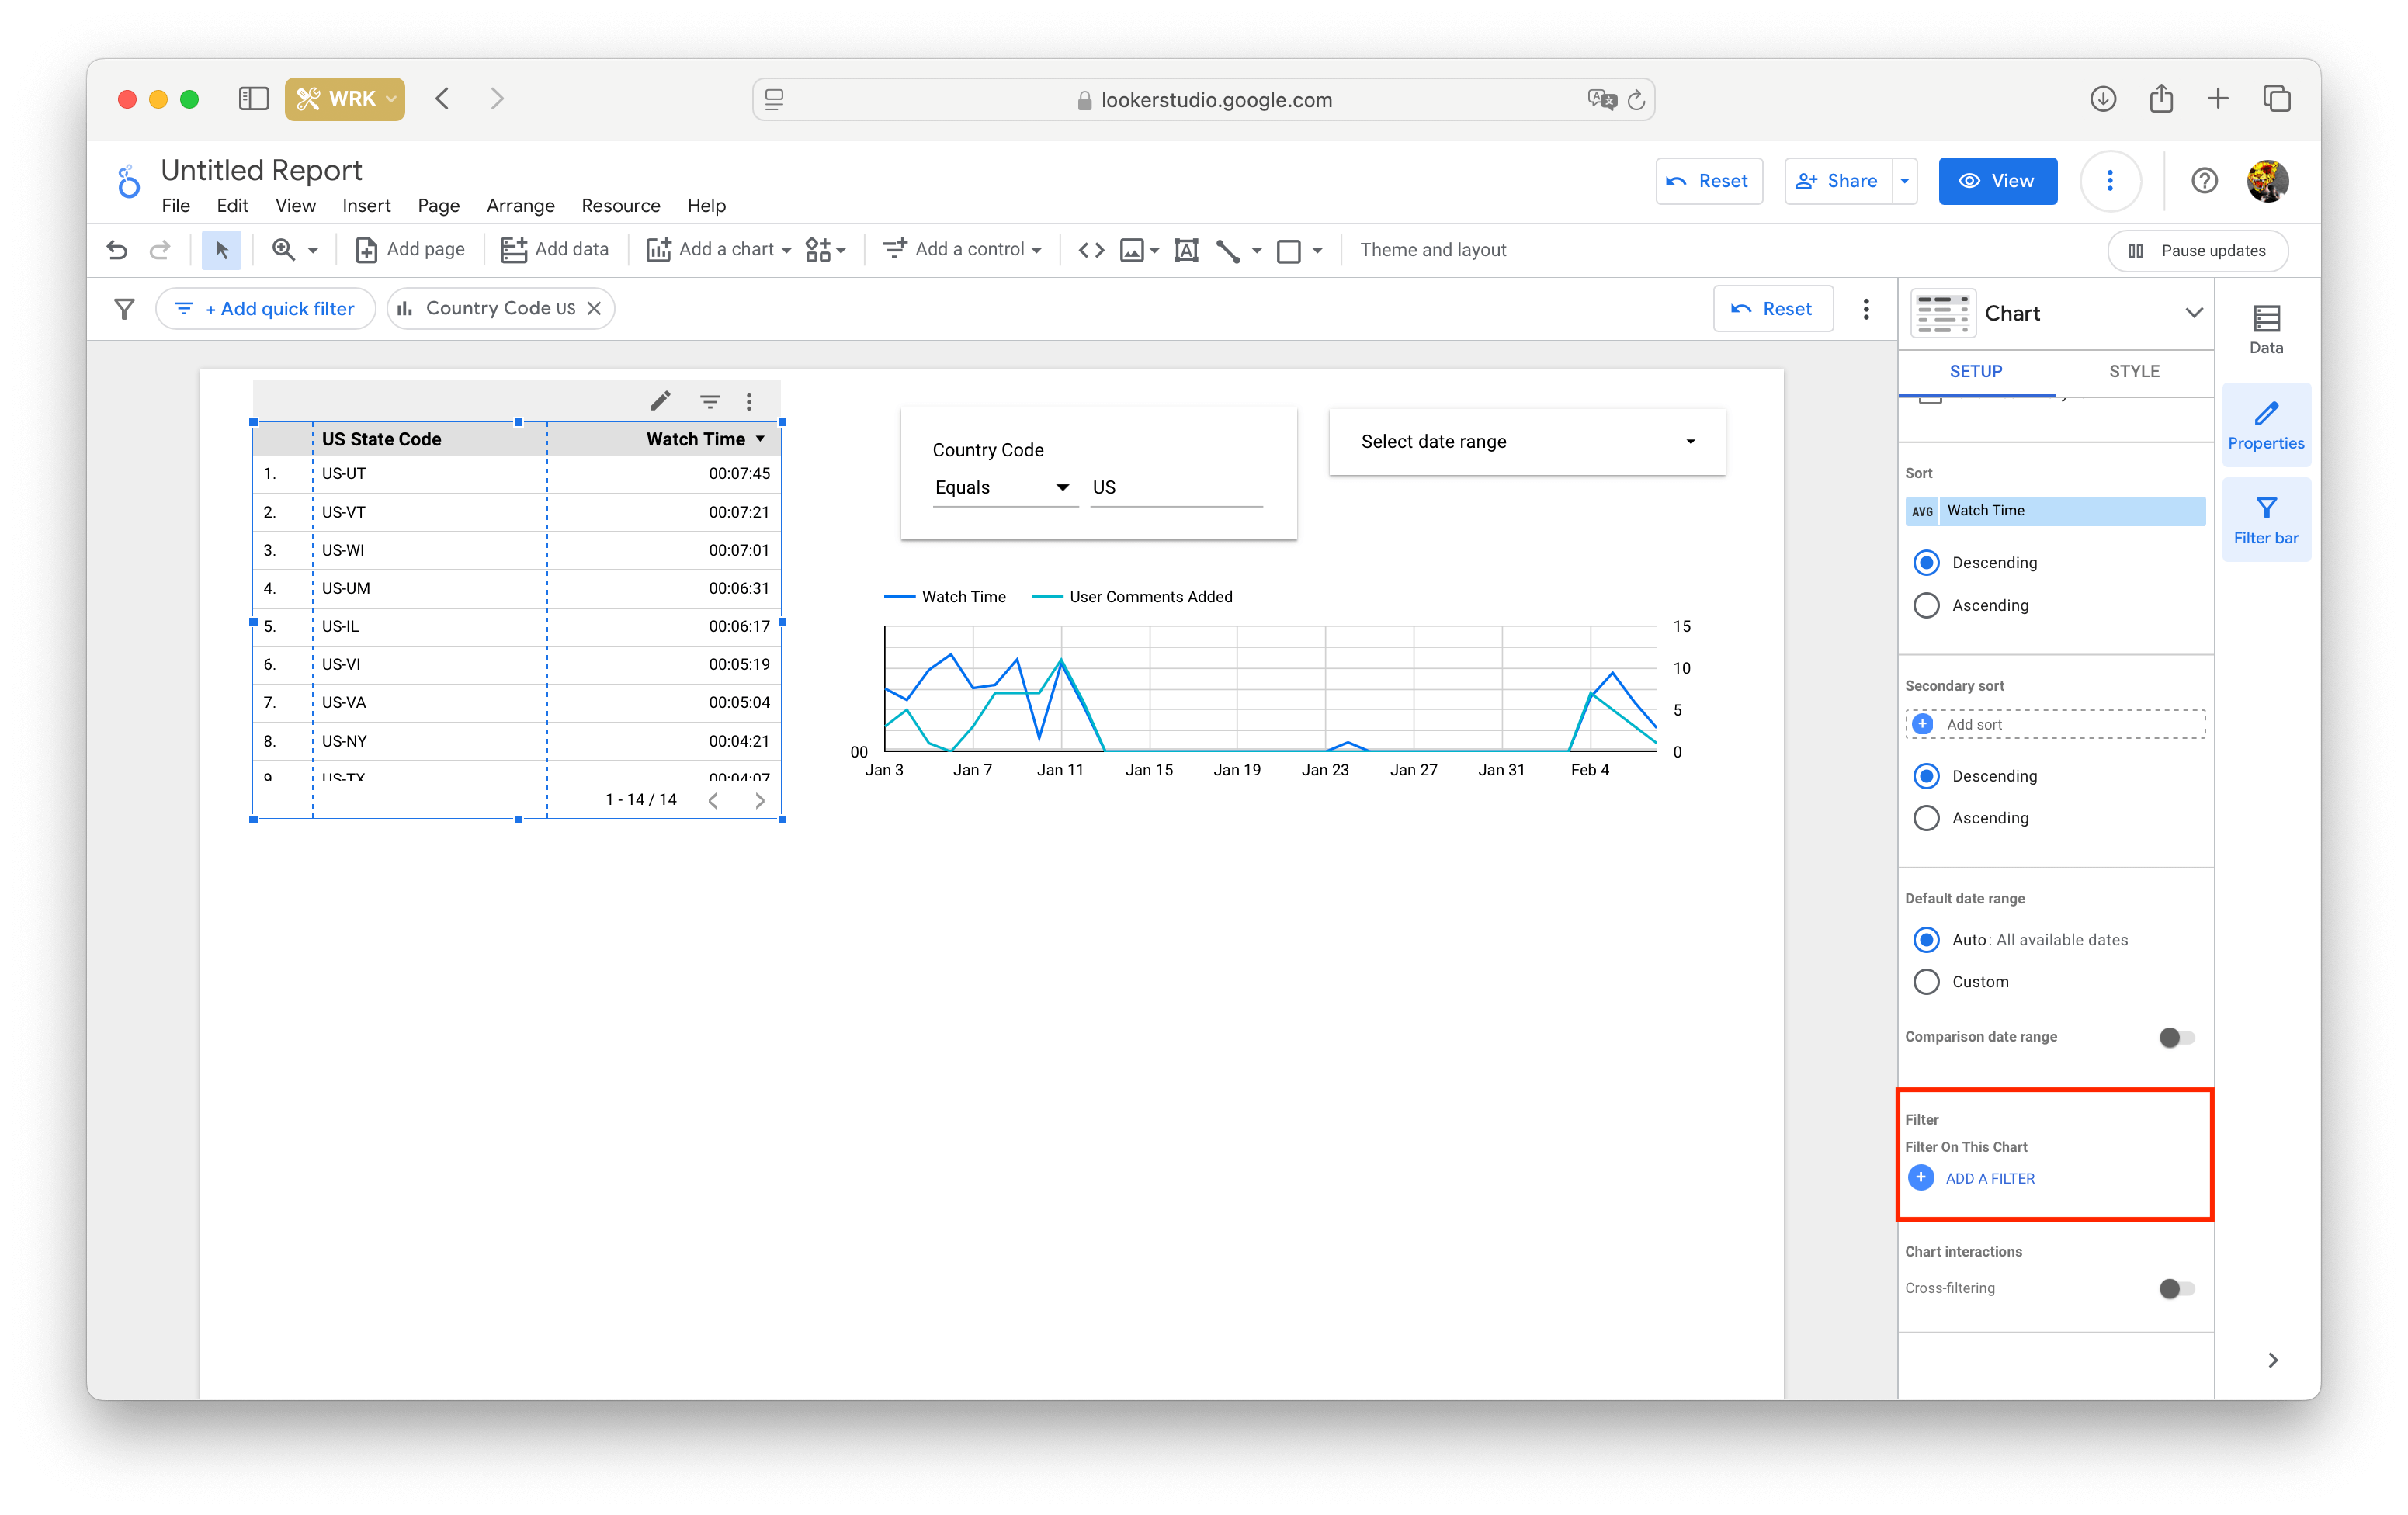
Chart filter
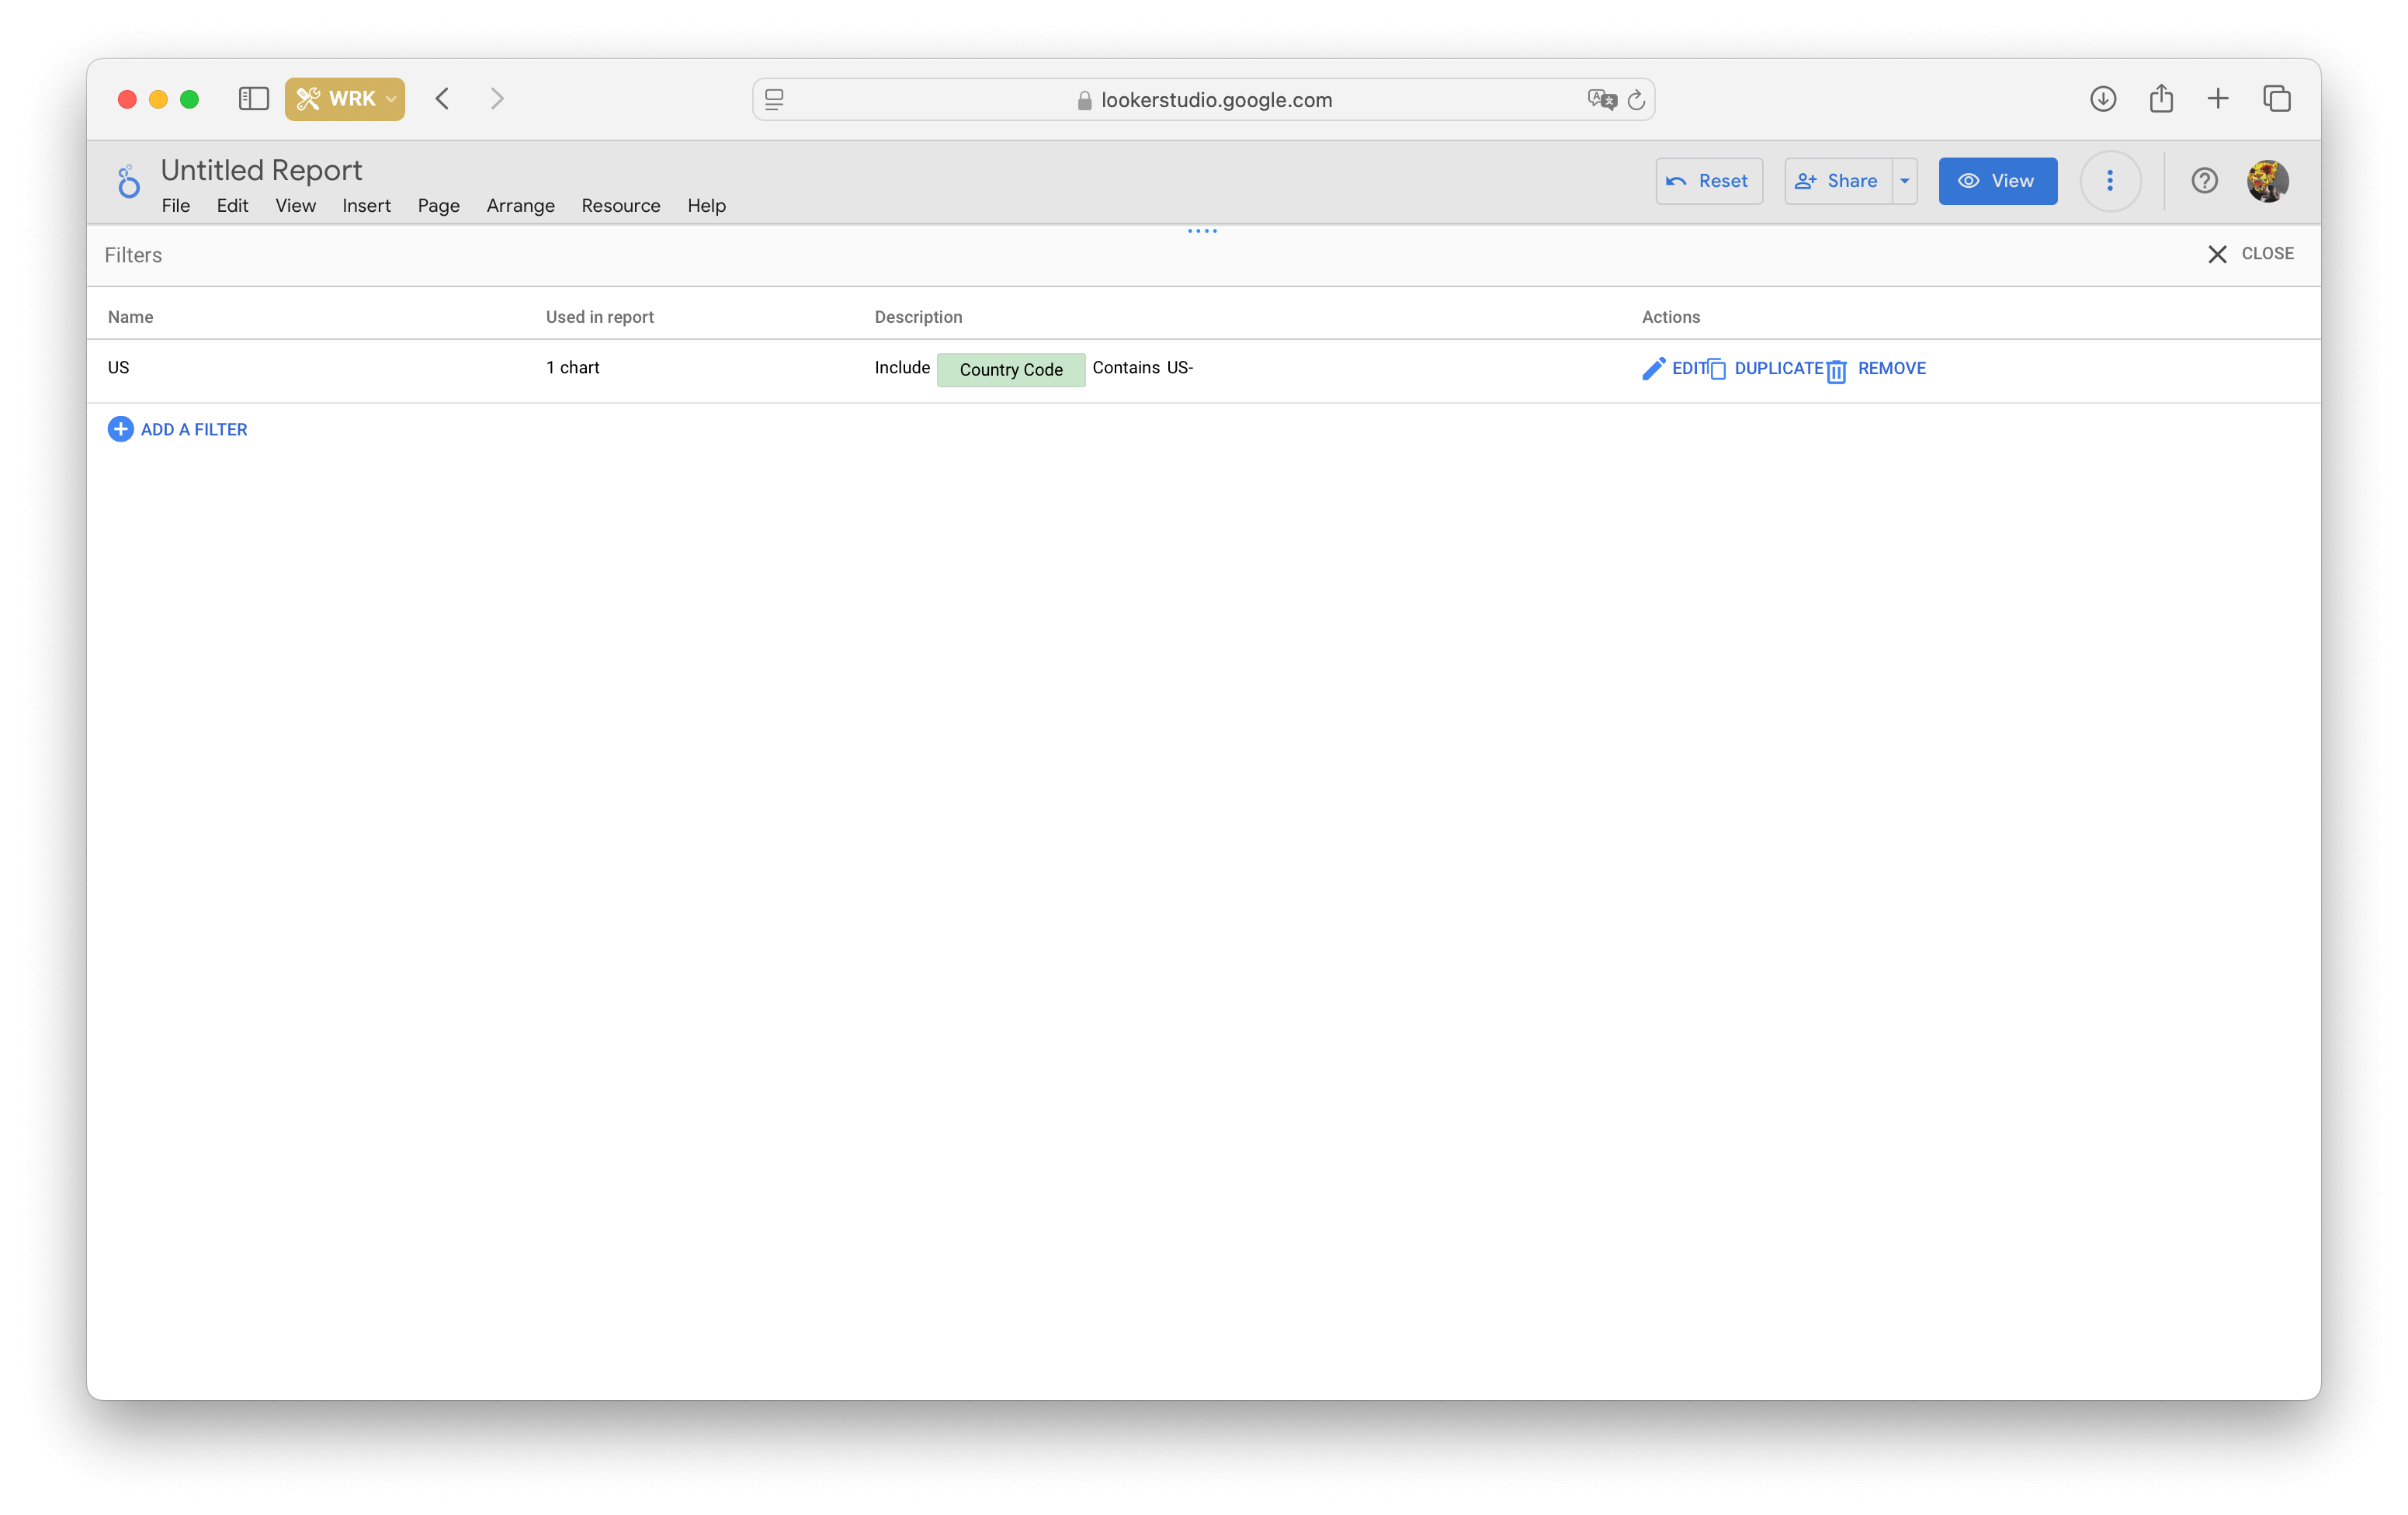
You can also filter data within individual tables, charts, graphs, and summaries. Highlight an item and go to the 'Filter' section. If you've already created filters, they'll appear in the list; otherwise, click 'Add a filter'.
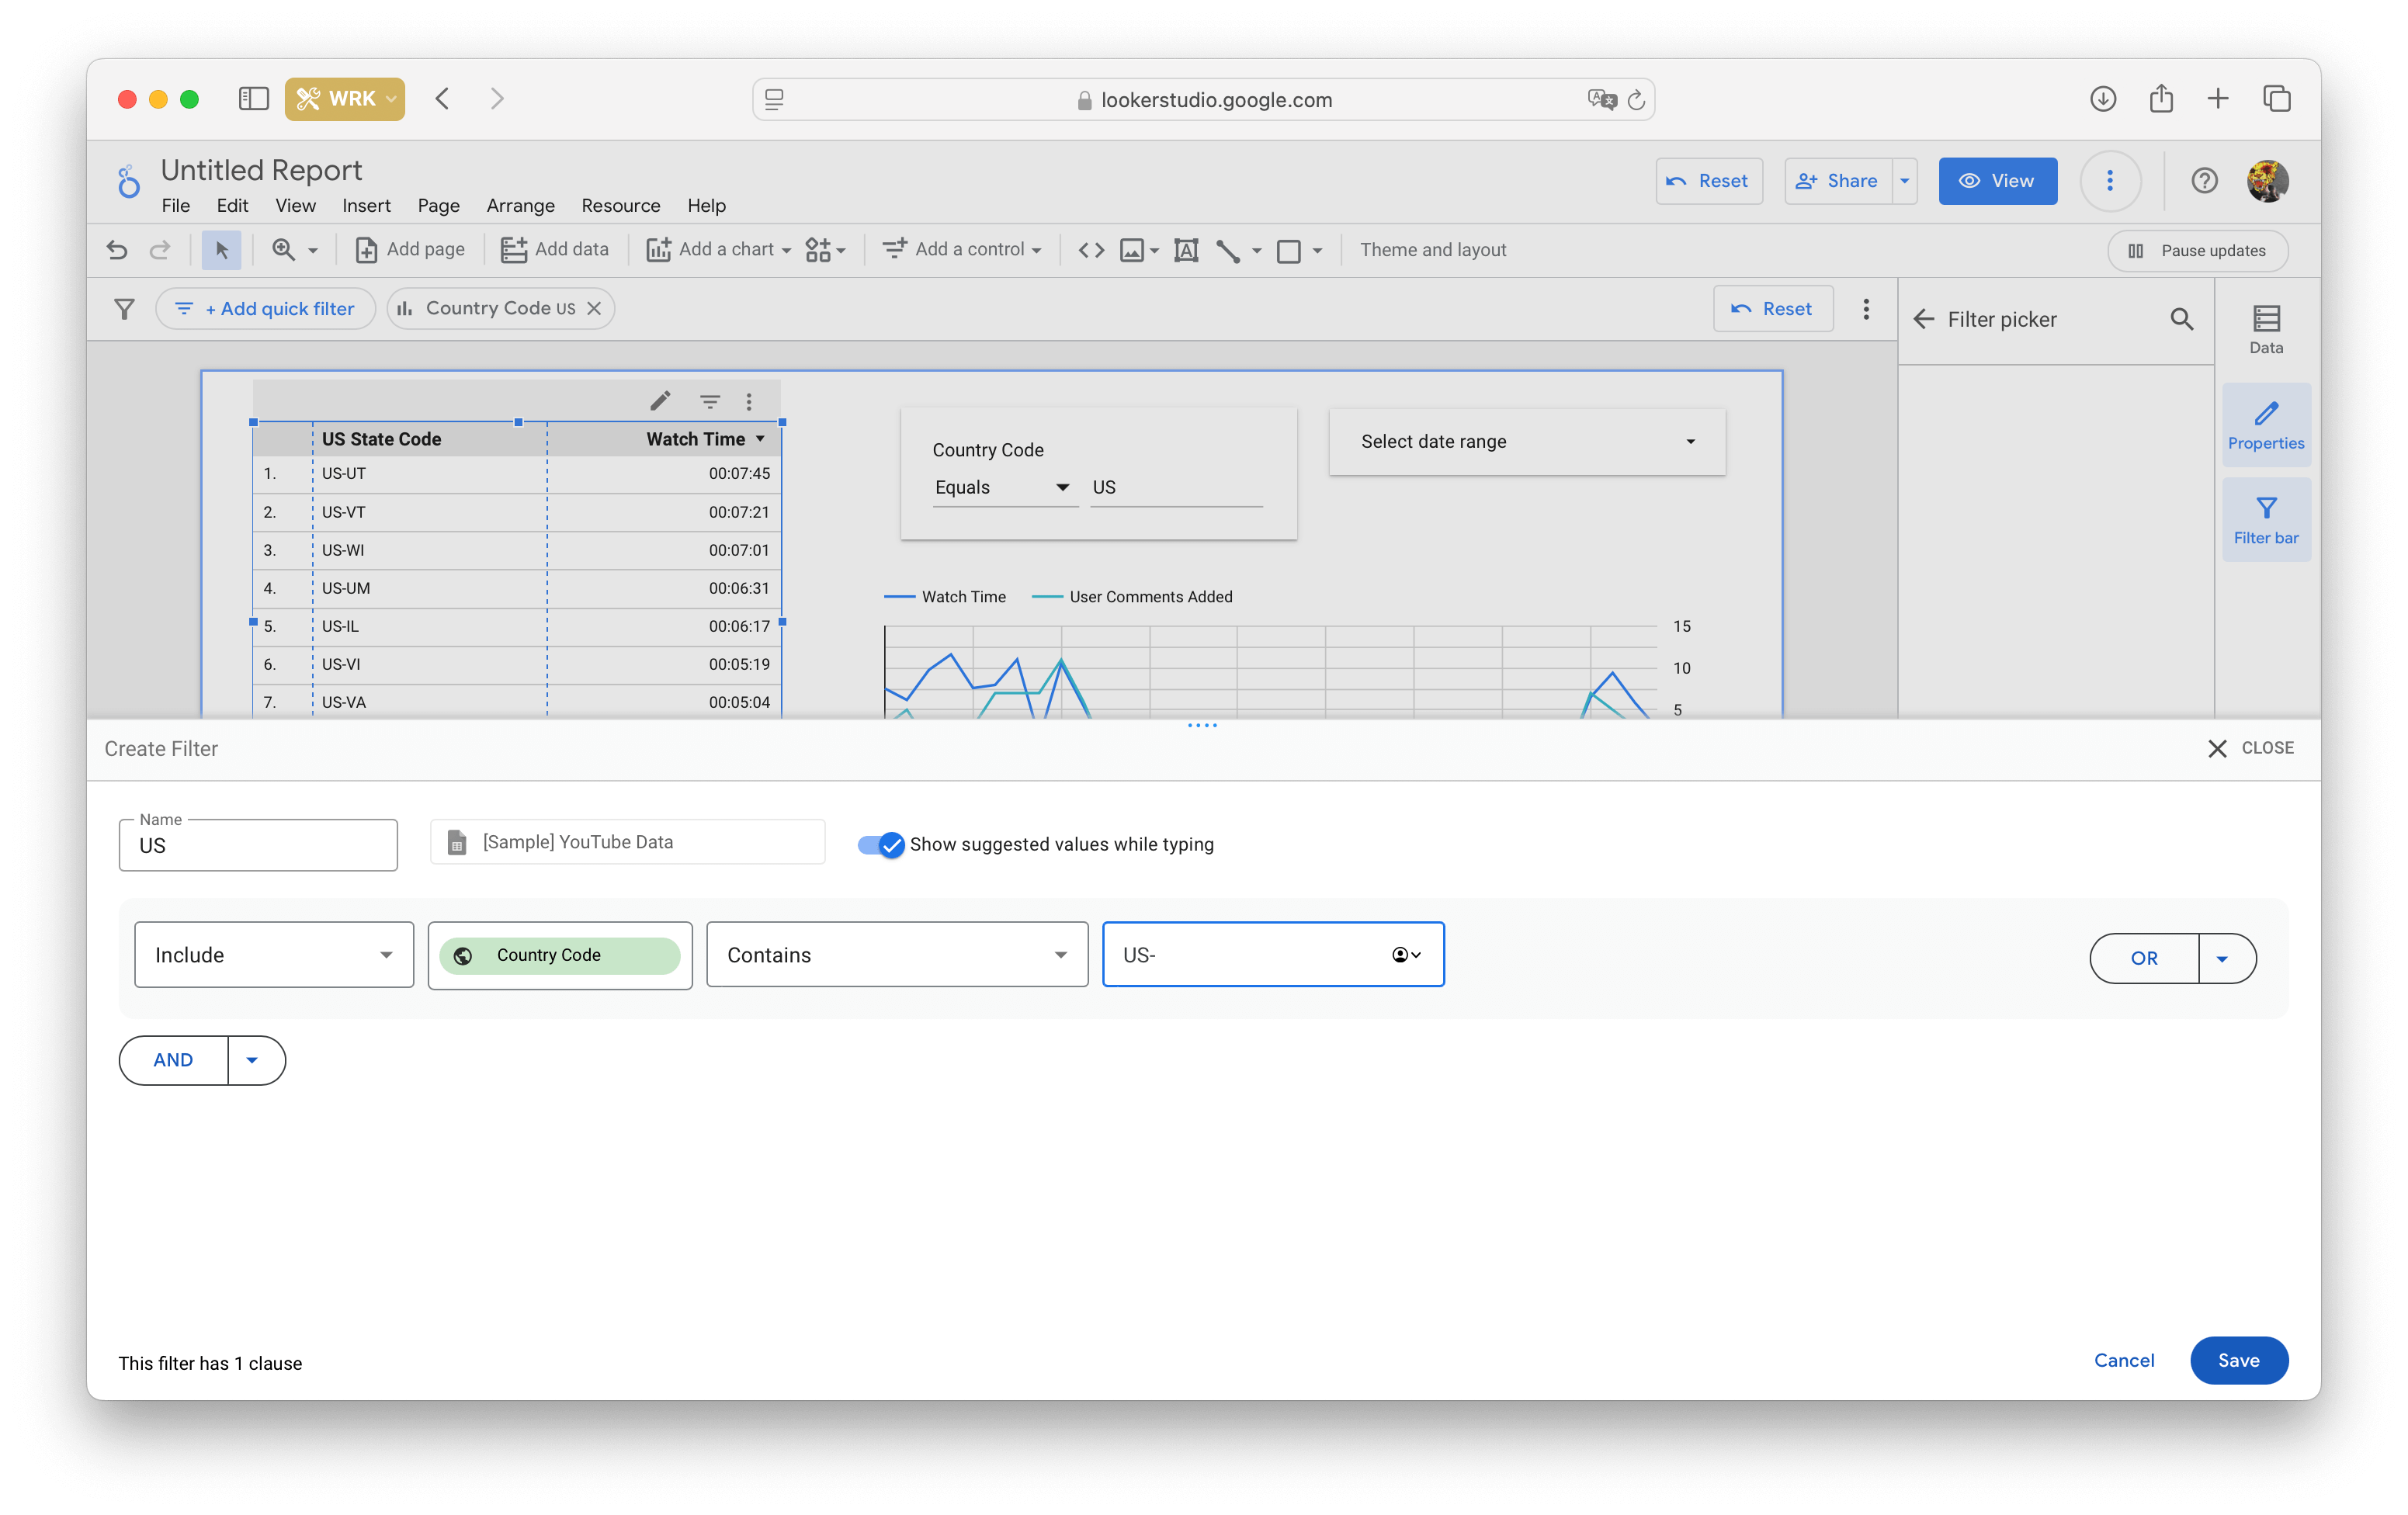
The filter creation window is essentially a simple builder: all that's left is to choose a name and fill in four fields of logical expressions:
- include/exclude
- dimension to apply the condition to
- Equals / Contains / Starts with / Regular expression
- value of the simension to include or exclude
You can combine several conditions with 'and' / 'or'.
Data Studio filters support regular expressions with the same syntax as Google Analytics. You can also apply multiple filters to a single item.
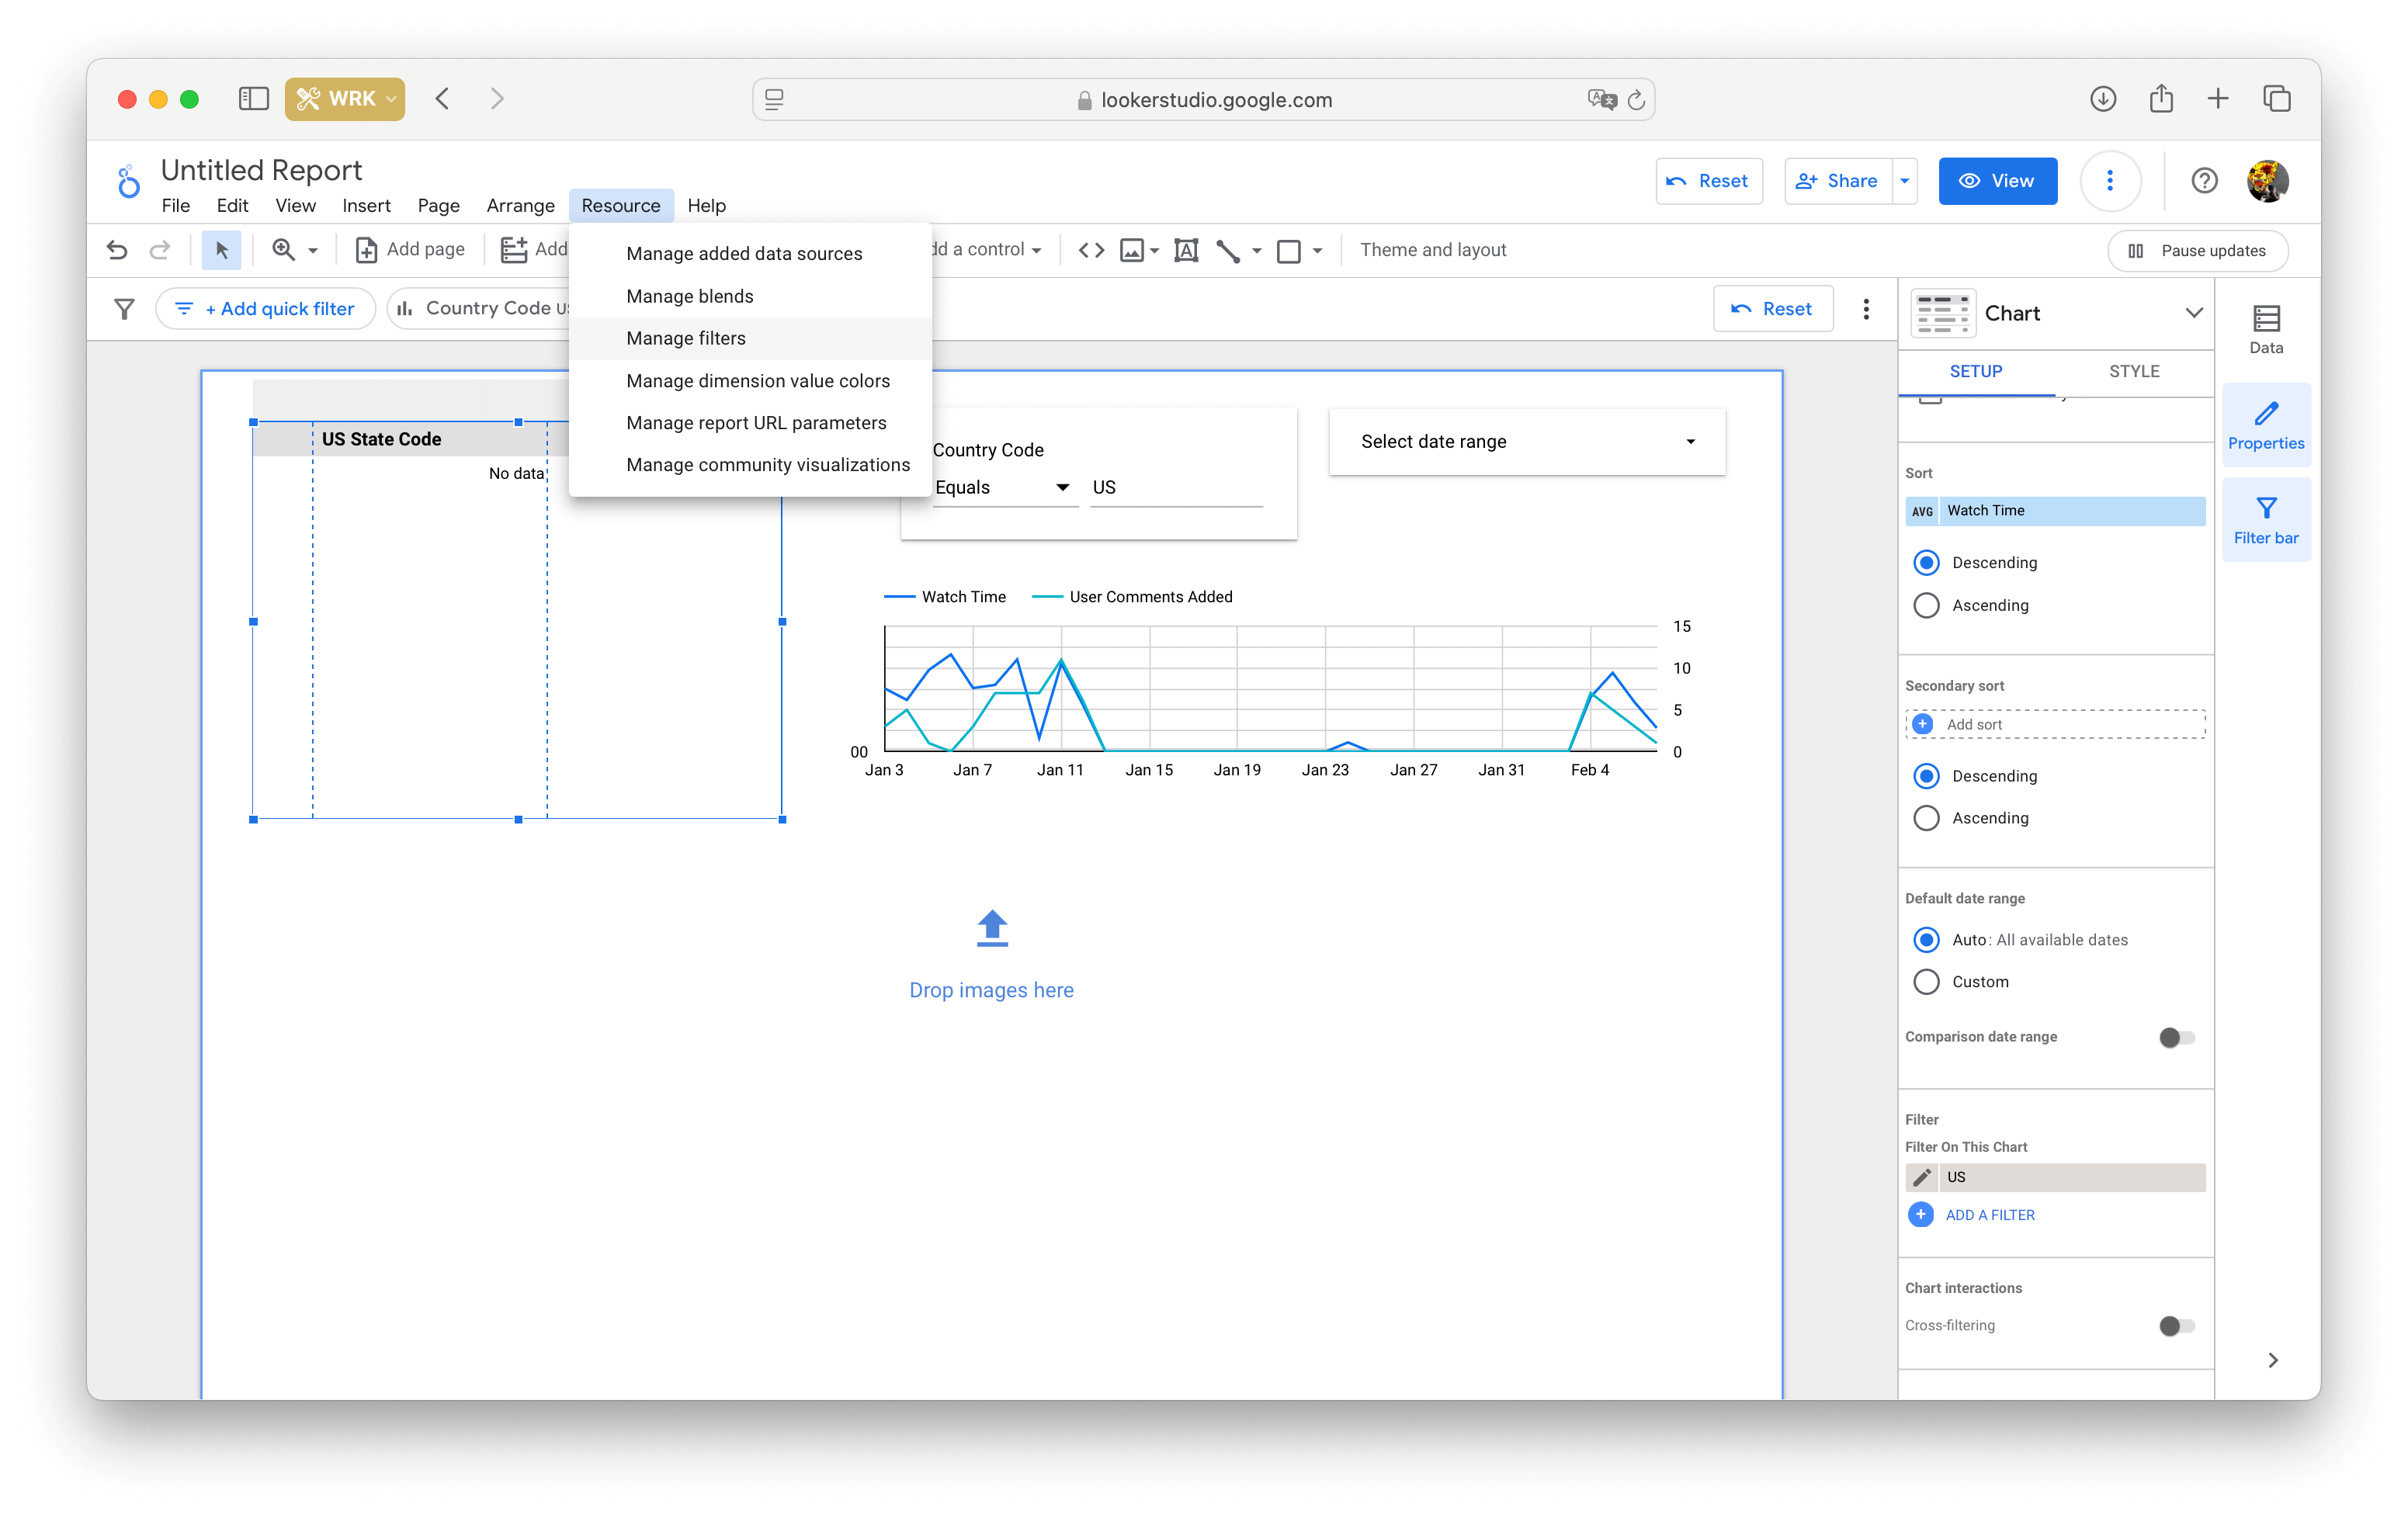
To view and manage your filters, go to Resource -> Manage Filters.
Saving and viewing reports
Like other Google services, Data Studio doesn't require manual saving — all changes are synced to the cloud automatically. If your Data Studio files were stored on Google Drive before Fall 2019, they're now only available within the service.
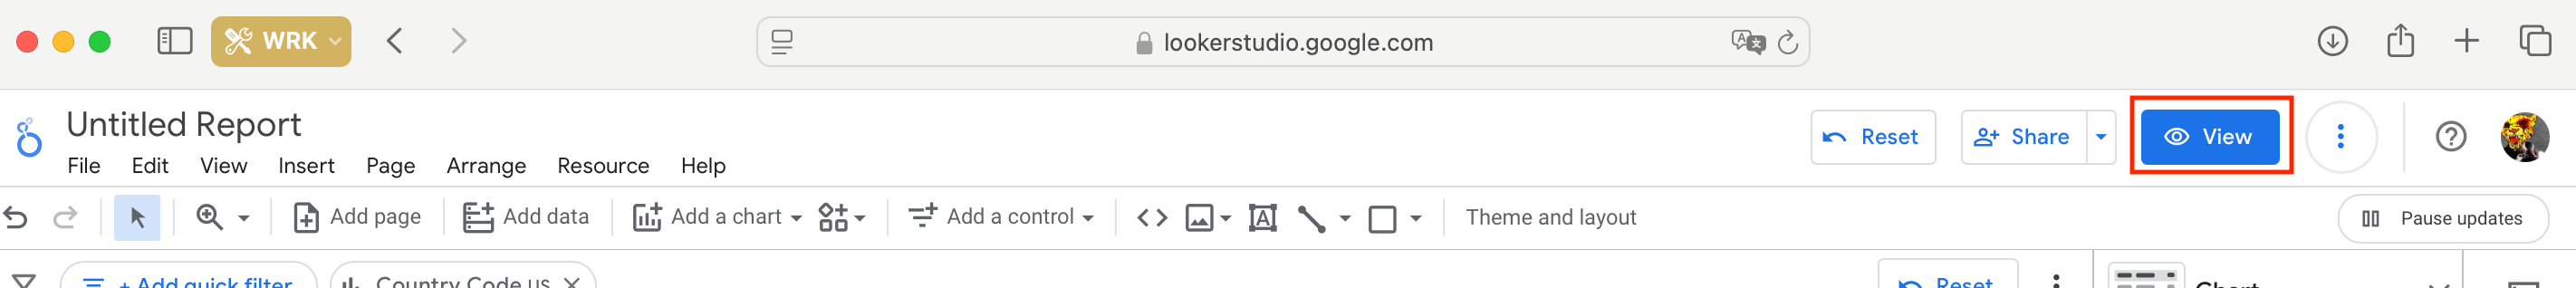
To switch from edit mode to view mode, tap the View button at the top of the screen.
To return to edit mode, click the blue Edit button.

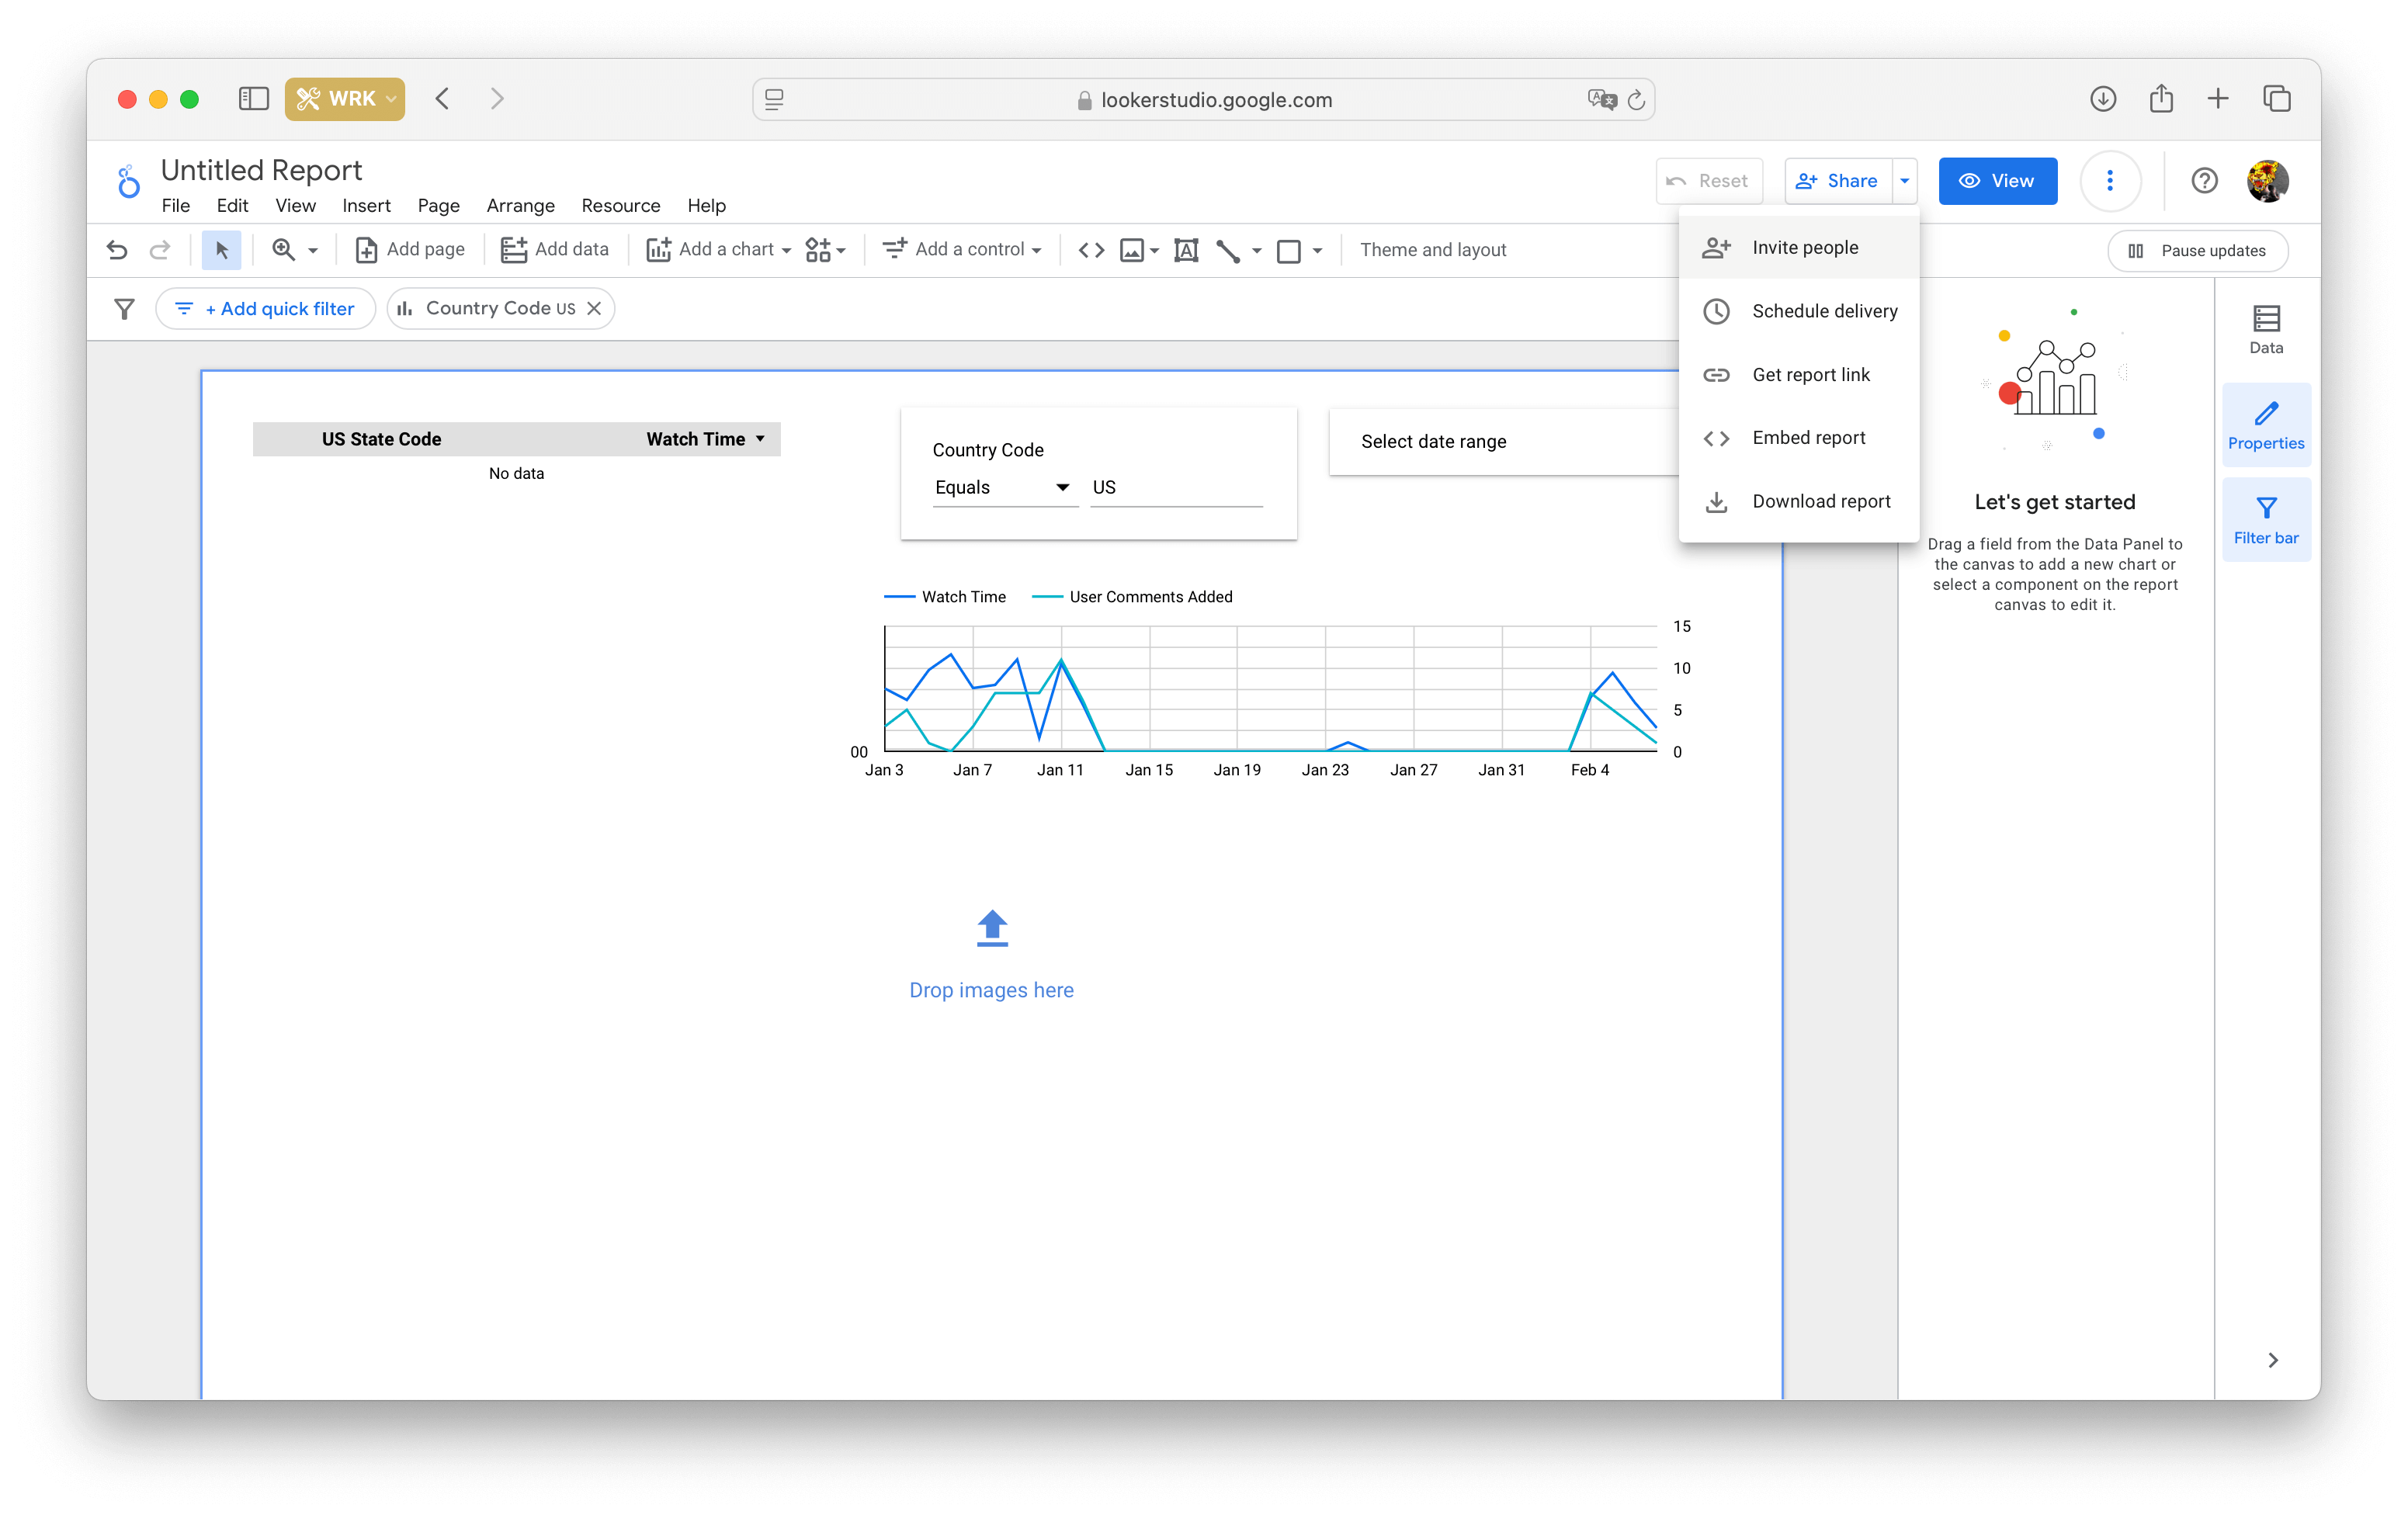
Sharing and exporting reports
All access and export settings can be found in the Share menu. From here, you can invite users, share a link, download the file as a PDF, set up automatic emailing of the report, or embed it on an external website.
Inviting users and sharing with a link
You can add users the same way as in Google Docs: enter their email address, configure access settings (view/edit) and send them an invitation.
Just like in GDocs, sharing a link also works — you can choose from five modes:
- Restricted — only users invited by email will see your report
- Public — the report becomes publicly available, including through search engines.
- Unlisted — only people with the link will see the report.
Important note: sharing an unlisted link isn't a completely secure option. If you accidentally or intentionally share the link publicly, anyone on the Internet will be able to access your file. For example, in 2018, search engines accidentally indexed a lot of Google Docs files with the 'share link' setting enabled, exposing sensitive user data.
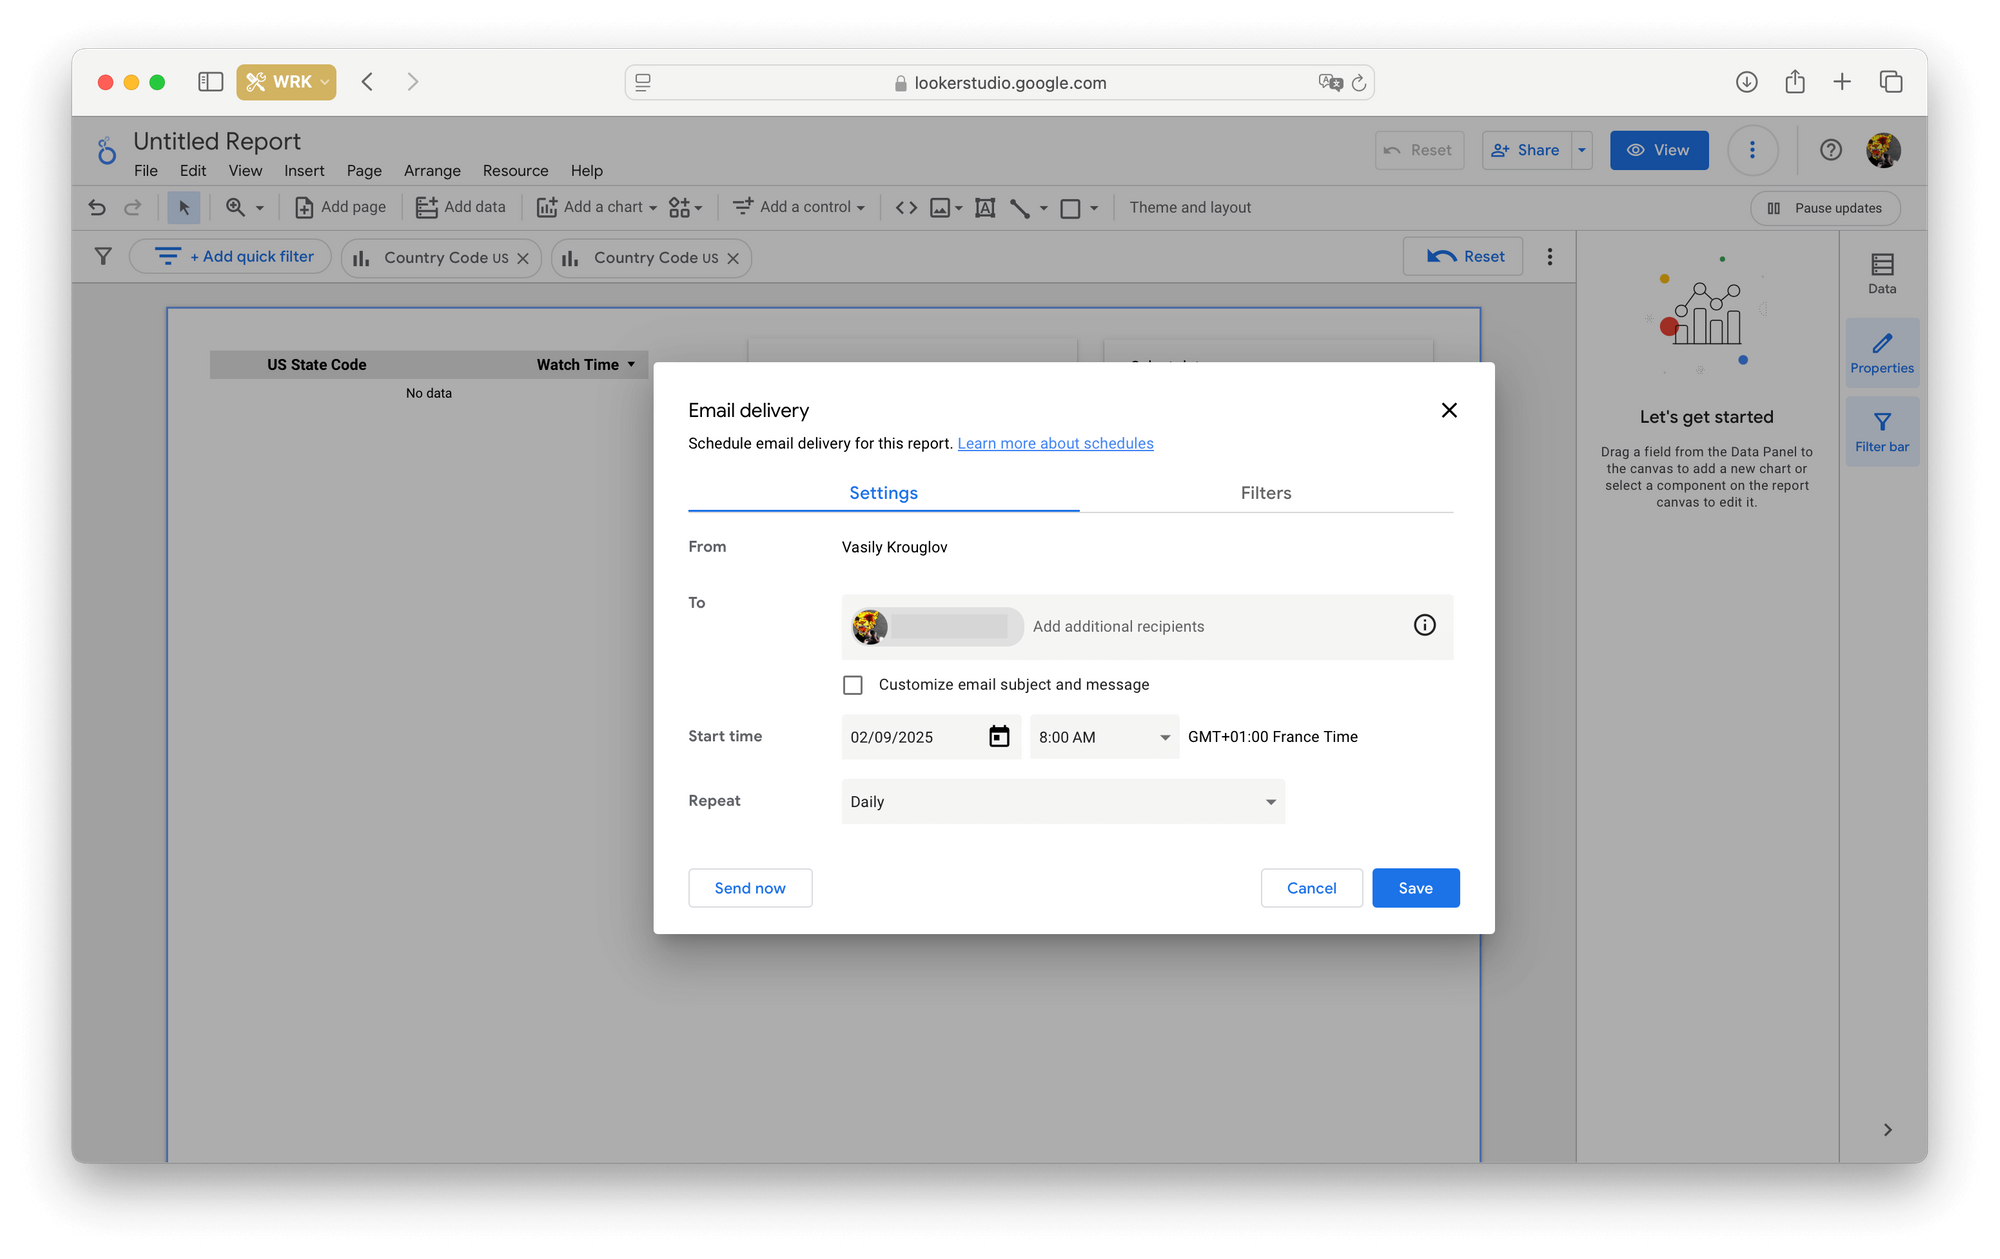
Email report delivery
Google Looker Studio will email your report based on a pre-defined schedule. You can adjust the schedule or cancel the automatic sending from the same menu.
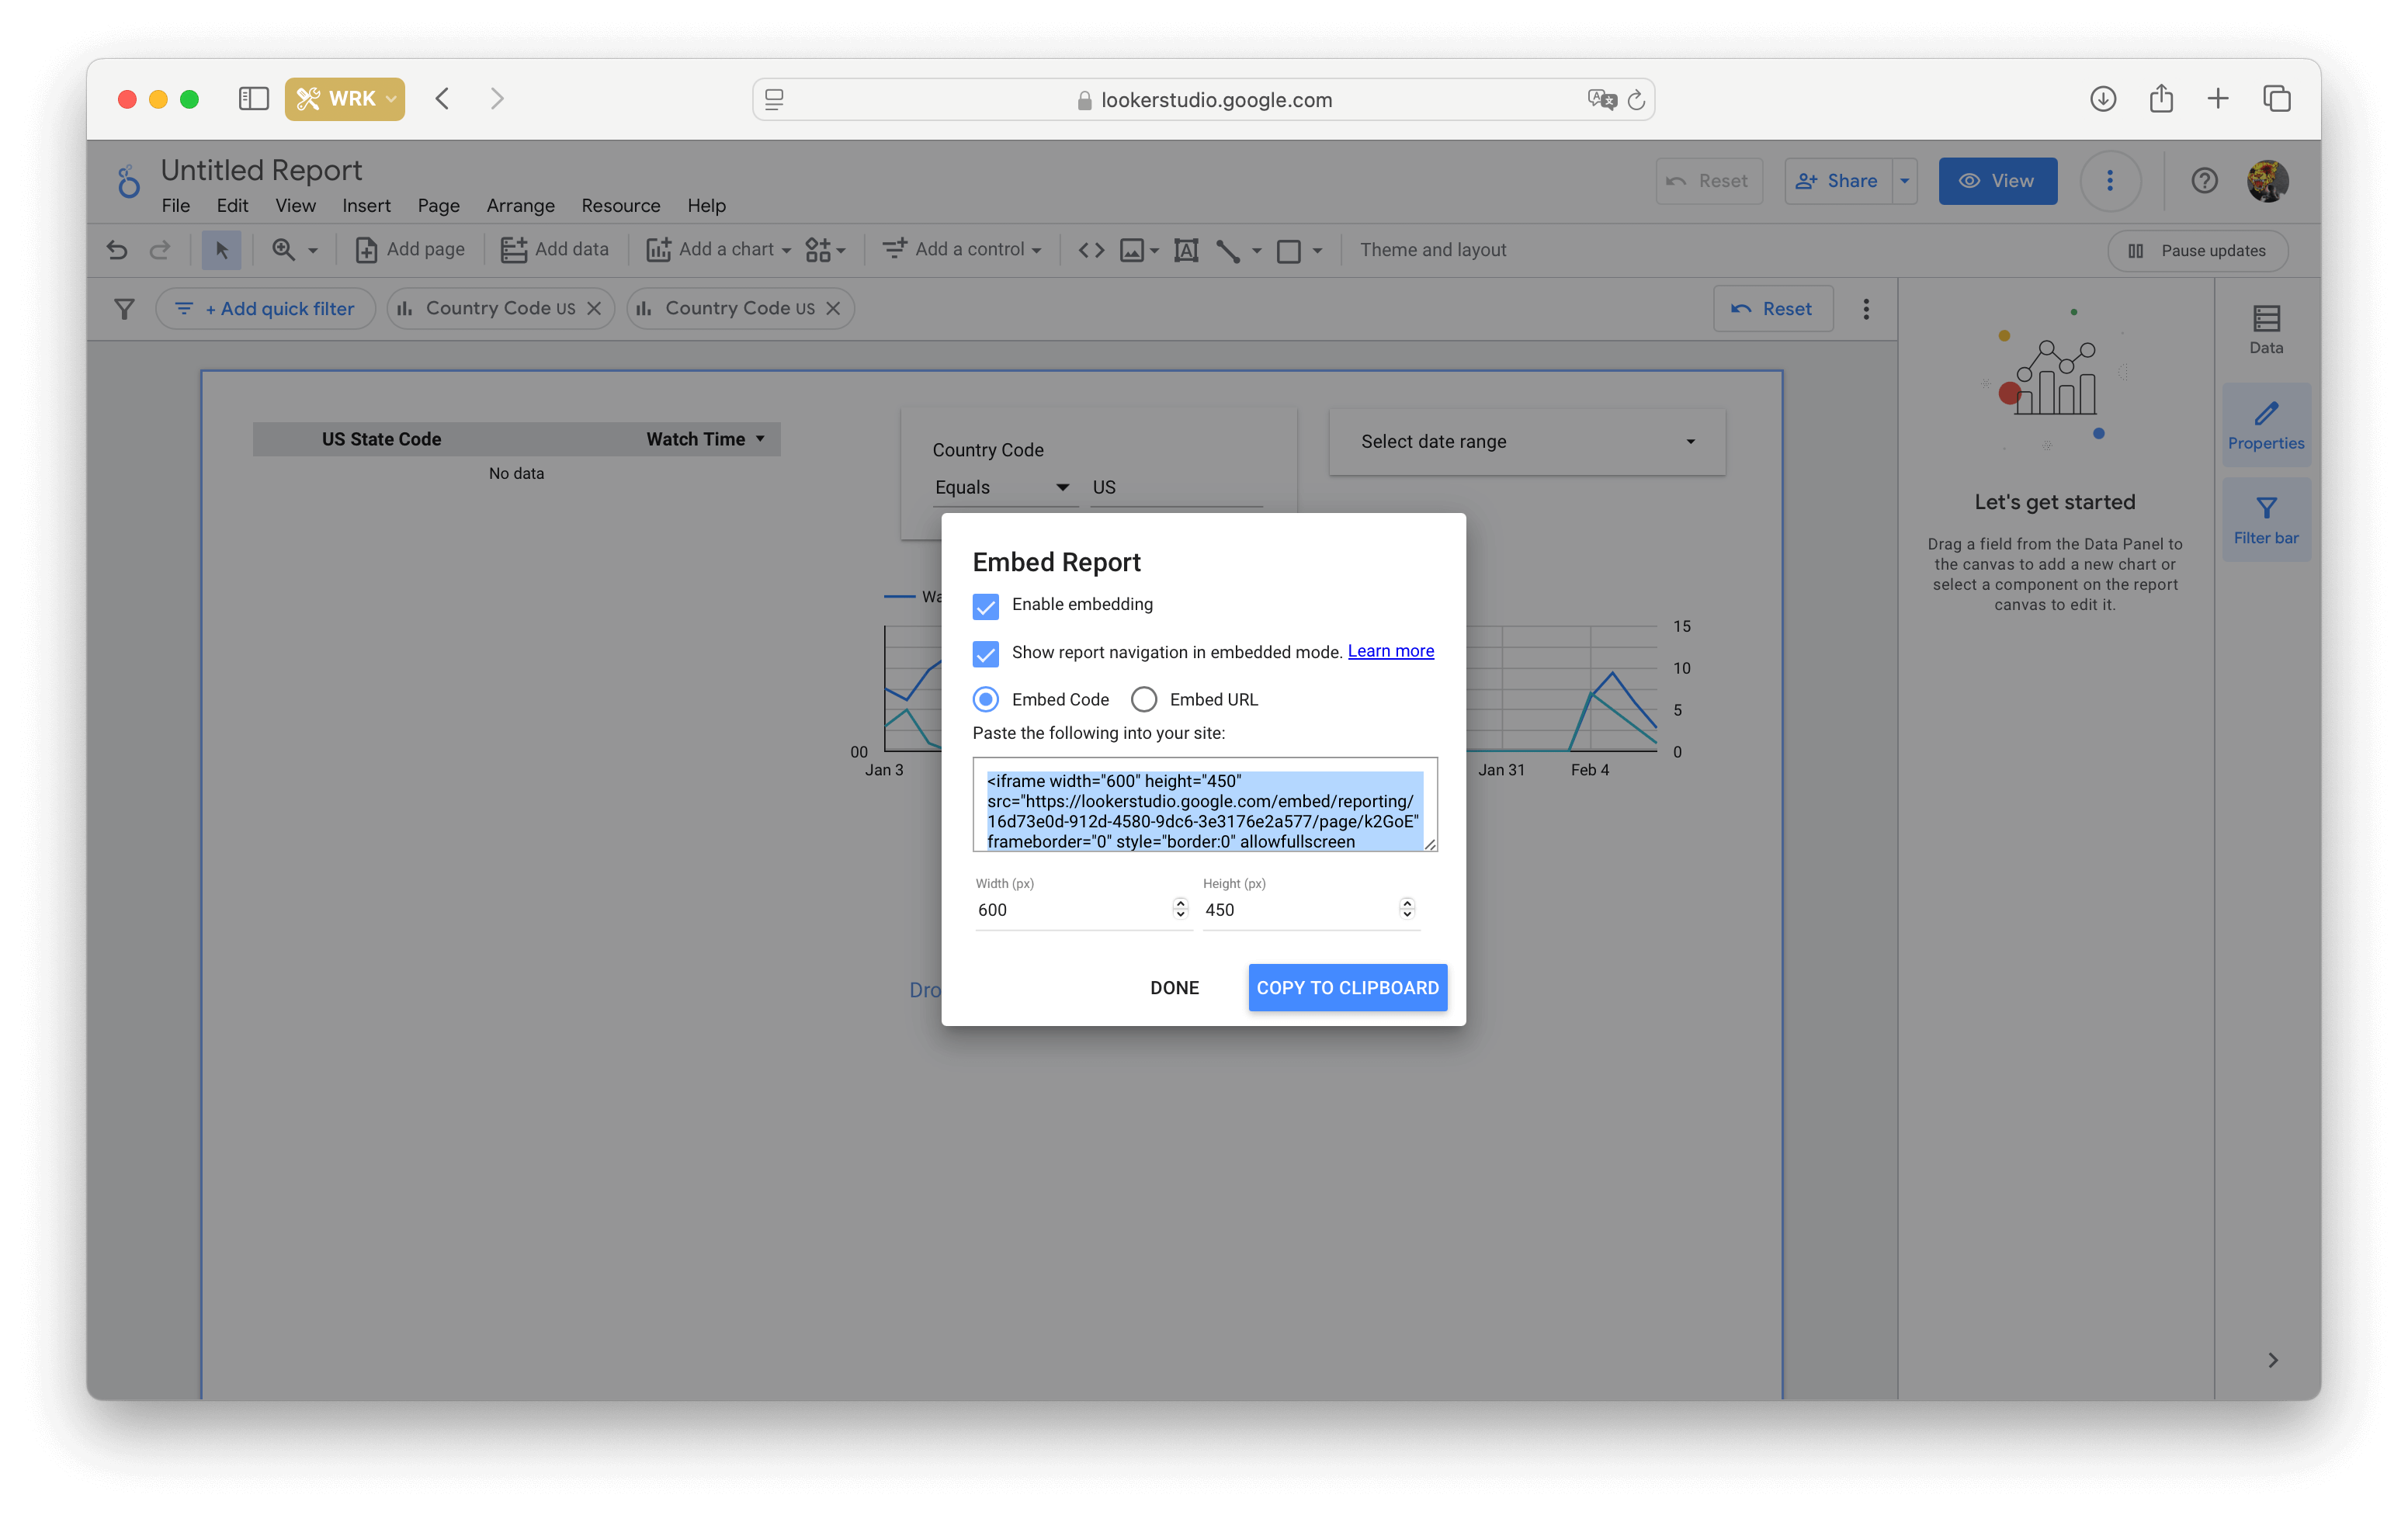
Embedding on your website
You can add your report to an external resource using an iframe tag. To do so, allow embedding, select the size, and paste the code to your website.
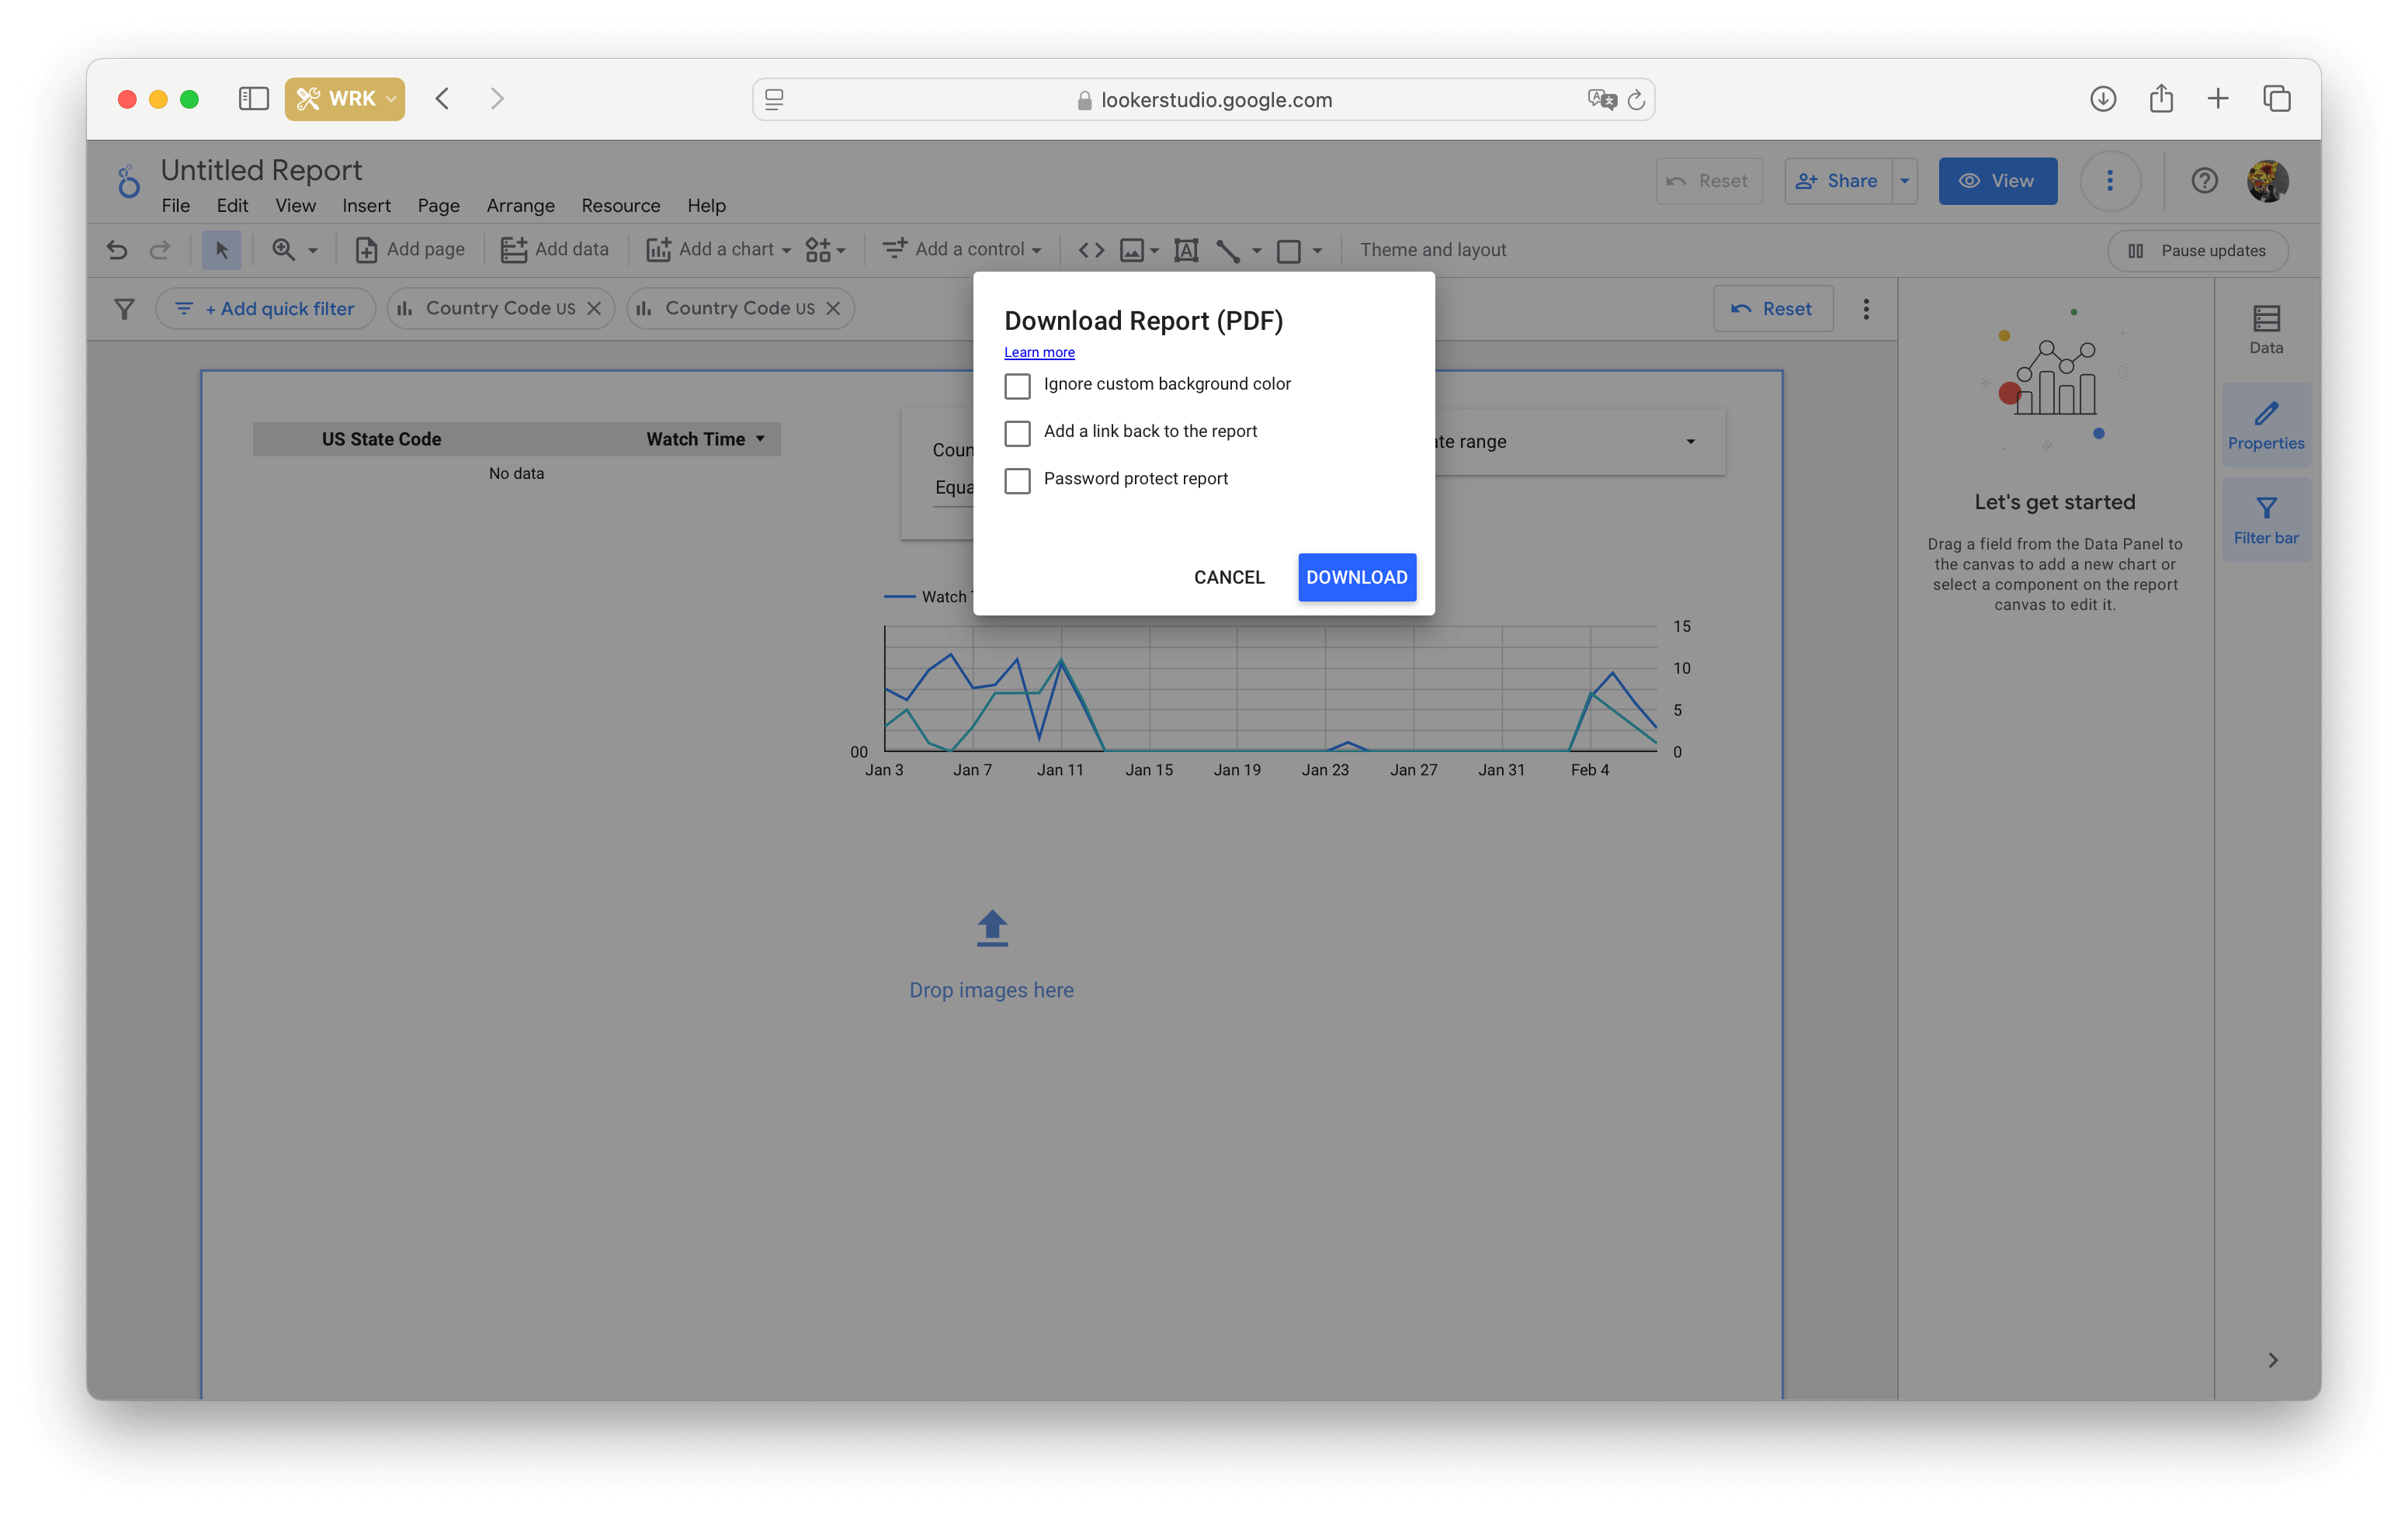
PDF Export
You can only export a report in PDF format, but you can protect it with a password and link it to your Data Studio document.
Analyze your report in Google Analytics
As a nice bonus, Looker Studio allows you to analyze user interaction with your report. Simply add a Google Analytics tracking ID from the File -> Report Settings menu.
Shortcuts in Looker Studio
Useful shortcuts in addition to the standard ⌘/Ctrl+C, ⌘/Ctrl+X and ⌘/Ctrl+V are:
- Group – ⌘/Ctrl + G
- Ungroup – ⌘/Ctrl + Shift + G
- Duplicate – ⌘/Ctrl + D
- Move forward – ⌘/Ctrl + Shift + ↑
- Move backward – ⌘/Ctrl + Shift + ↓
- Refresh the data – ⌘/Ctrl + Shift + E
- Show version history – ⌘/Ctrl + Alt + Shift + H
- Add a new page – ⌘/Ctrl + M
Using templates
Data Studio has a 'Reports Gallery' that can be accessed via the question mark button or a direct link.
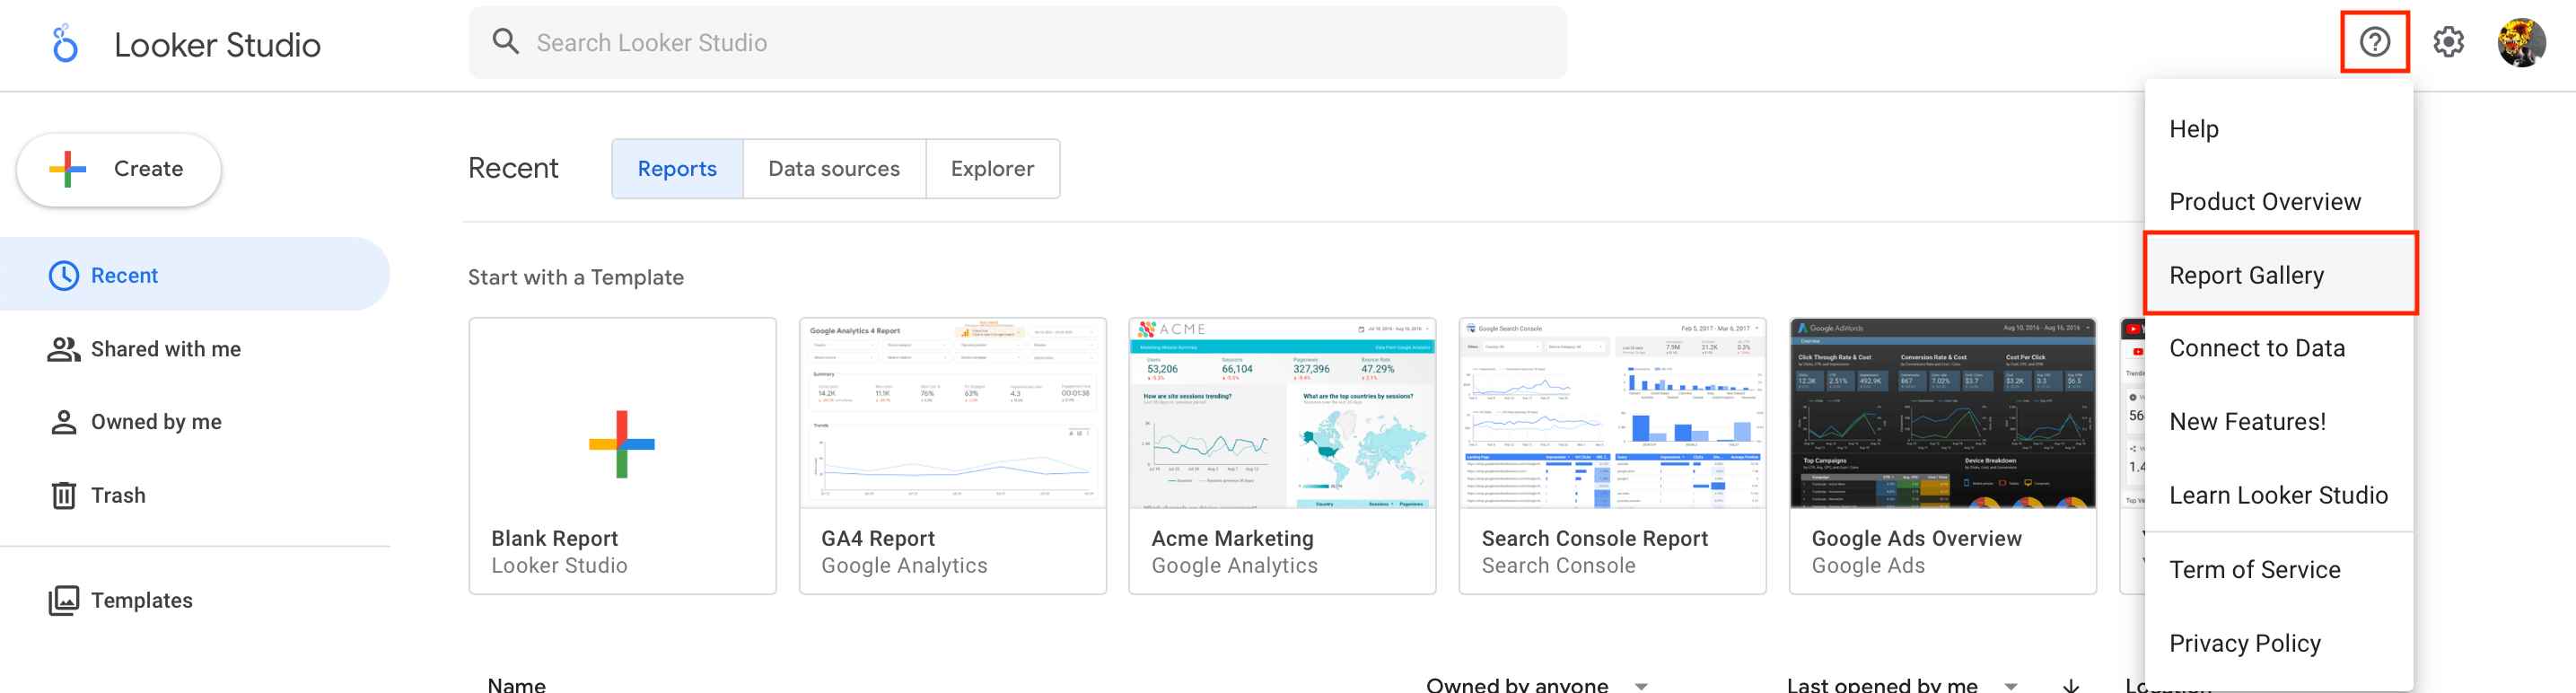
The gallery has three sections. The Featured section contains reports, recommended by Google; Marketing Templates is where you can choose a template for a marketing report; Community is a bunch of reports created by users.
Important note: be careful when selecting a template — the Reports Gallery also contains pre-built reports with public data. For example, the International Space Station's positions, the FIFA World Cup stats, or even articles from the New York Times; you are able to copy such reports, but customizing them will make no sense.